使用Pyecharts实现航线图效果
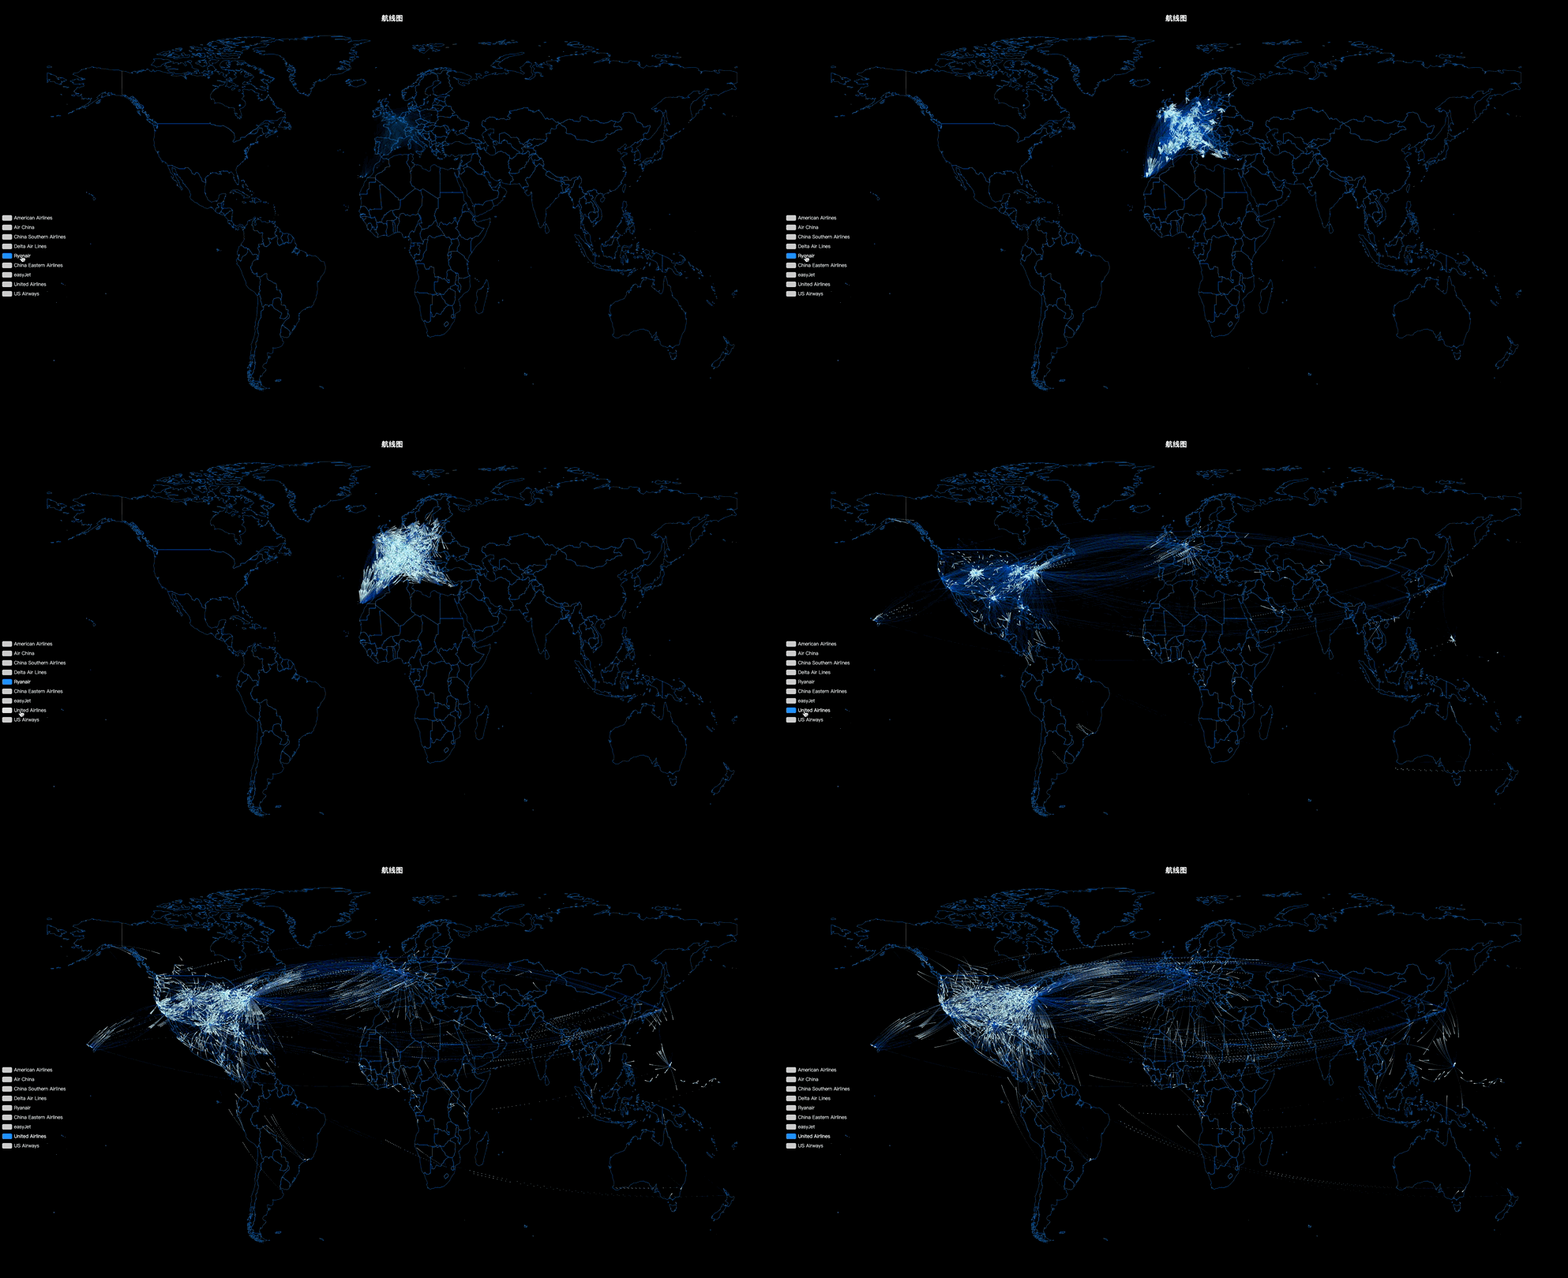
航线图是基于Echarts官网的示例航线图通过Pyecharts来实现的,当然由于Pyecharts还是诸多限制,并不能100%还原。
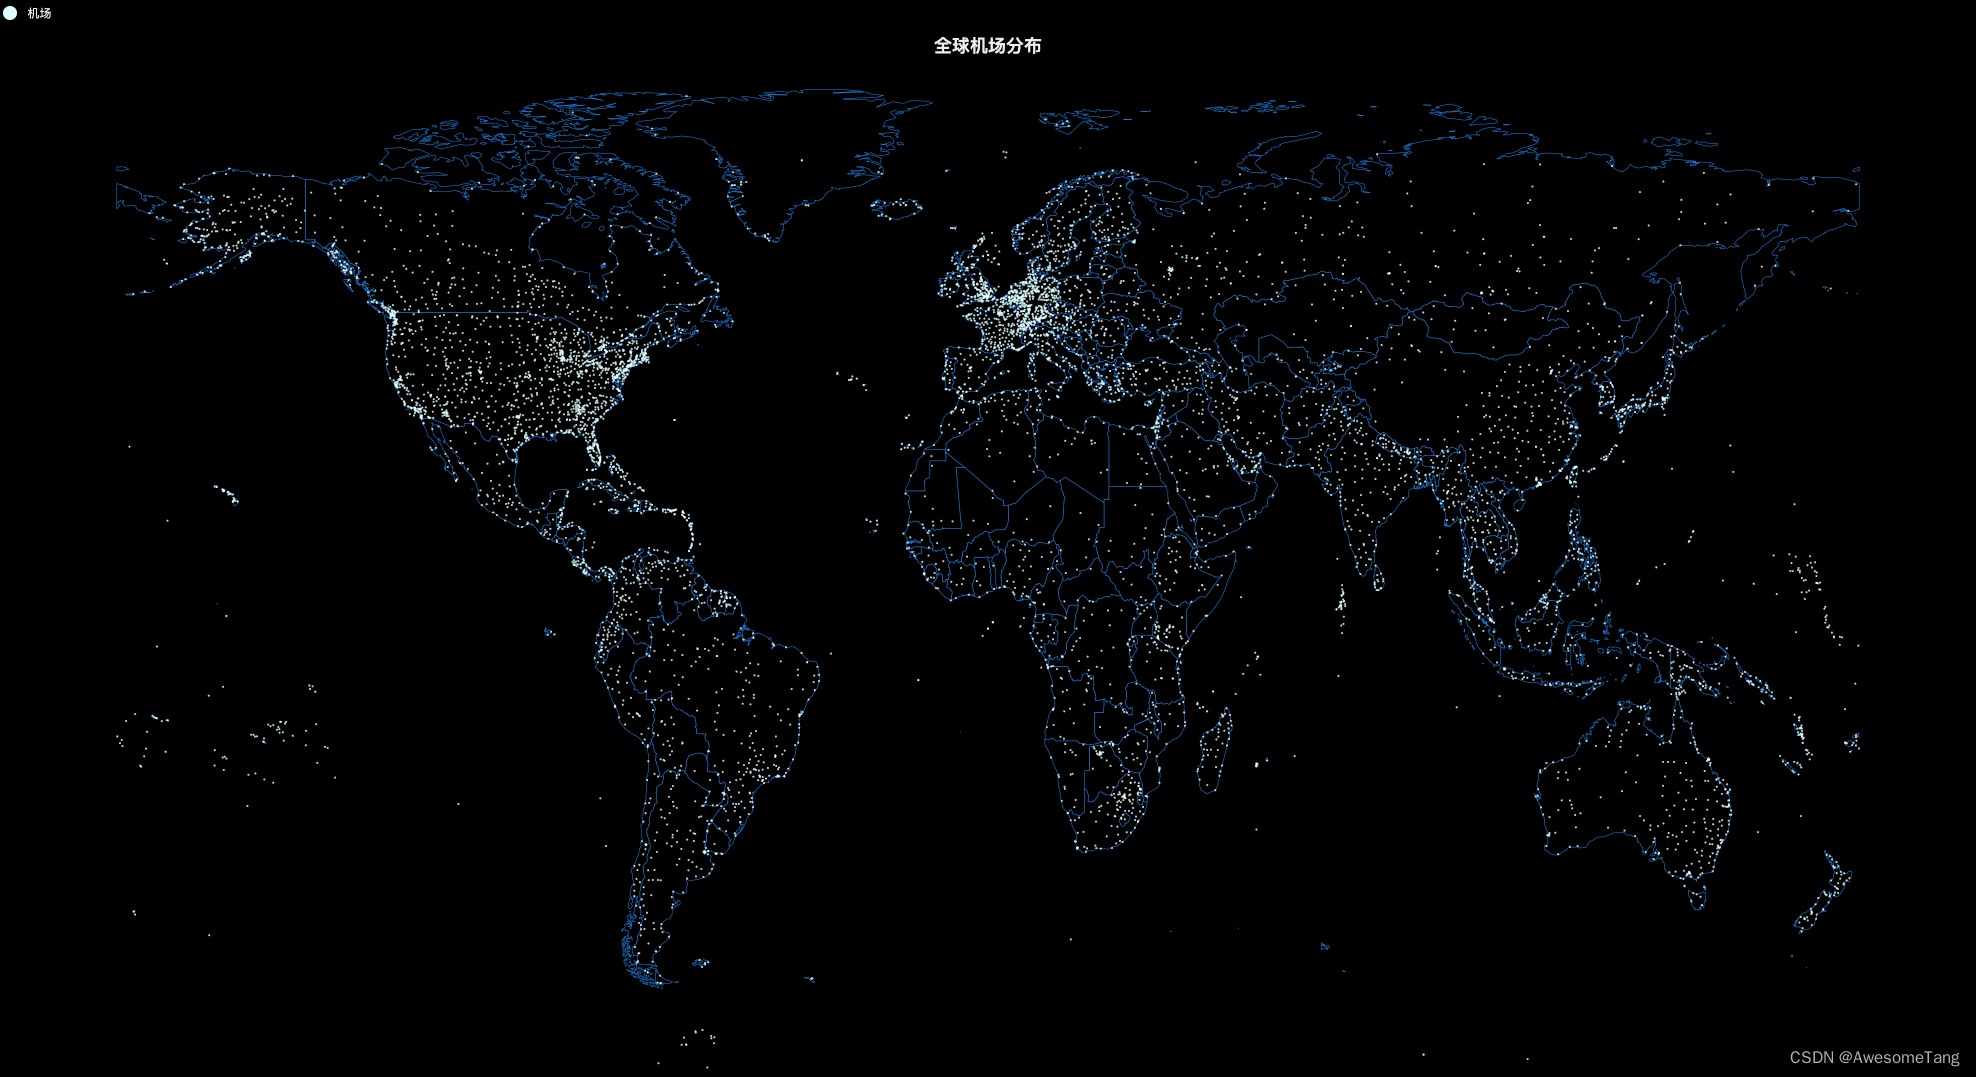
本次实现了全球机场分布图和航线图效果(支持切换航司):
所有的数据都存储与flights.json中,数据包含三个部分:
# 读取航线文件
with open("flights.json", 'r') as f:
    data = json.loads(f.read())

airports = data['airports']
airlines = data['airlines']
routes = data['routes']airports: 机场的位置信息;airlines:航司信息;routes:航线的信息,包含航线的出发机场和到达机场的信息;
通过GEO-Scatter绘制的机场分布图。
机场的位置信息并不像北京、上海这些常见地点已经在Pyecharts中内置,需要我们手动添加位置添加到GEO实例中去;
# 新建一个GEO图表
geo = Geo(init_opts=opts.InitOpts(theme='dark', bg_color='#000000', width='1980px', height='1080px'))
for idx, item in enumerate(airports_data):
    # 新增机场位置信息到geo
geo.add_coordinate(str(idx), item[3], item[4])添加地图以及基础样式配置:
emphasis_xxx:配置高亮状态(选中时)的样式,如标签,颜色等;
geo.add_schema(
        maptype="world",
        is_roam=False,  # 禁止缩放
        zoom=1.1,  # 显示比例
        itemstyle_opts=opts.ItemStyleOpts(color="#000000", border_color="#1E90FF"),
        emphasis_label_opts=opts.LabelOpts(is_show=False),
        emphasis_itemstyle_opts=opts.ItemStyleOpts(color="#323c48")
    )
添加数据 添加数据到GEO图表和数据展示样式的配置,如提示框,图例等等;
    geo.add("机场",
            data_pair,
            type_='scatter',
            is_selected=True,
            symbol_size=2,
            is_large=True,
            itemstyle_opts=opts.ItemStyleOpts(color="#E1FFFF")
            )

    # 关闭Label显示
    geo.set_series_opts(label_opts=opts.LabelOpts(is_show=False))

    geo.set_global_opts(
        title_opts=opts.TitleOpts(title="全球机场分布", pos_top='3%', pos_left='center'),
        tooltip_opts=opts.TooltipOpts(is_show=False),  # 关闭提示框
        legend_opts=opts.LegendOpts(is_show=True, pos_left='left', pos_top='2', orient='vertical')
)# 绘制全球机场散点图
def airports_viz(airports_data):
"""
绘制全球机场散点图
:param airports_data: 机场位置数据
:return: pyecharts GEO图表实例
"""
data_pair = []
geo = Geo(init_opts=opts.InitOpts(theme='dark', bg_color='#000000', width='1980px', height='1080px'))
for idx, item in enumerate(airports_data):
# 新增机场位置信息到geo
geo.add_coordinate(str(idx), item[3], item[4])
data_pair.append([str(idx), 1])
geo.add_schema(
maptype="world",
is_roam=False, # 禁止缩放
zoom=1.1, # 显示比例
itemstyle_opts=opts.ItemStyleOpts(color="#000000", border_color="#1E90FF"),
emphasis_label_opts=opts.LabelOpts(is_show=False),
emphasis_itemstyle_opts=opts.ItemStyleOpts(color="#323c48")
)
geo.add("机场",
data_pair,
type_='scatter',
is_selected=True,
symbol_size=2,
is_large=True,
itemstyle_opts=opts.ItemStyleOpts(color="#E1FFFF")
)
# 关闭Label显示
geo.set_series_opts(label_opts=opts.LabelOpts(is_show=False))
geo.set_global_opts(
title_opts=opts.TitleOpts(title="全球机场分布", pos_top='3%', pos_left='center'),
tooltip_opts=opts.TooltipOpts(is_show=False), # 关闭提示框
legend_opts=opts.LegendOpts(is_show=True, pos_left='left', pos_top='2', orient='vertical')
)
return geo其实航线图整个绘制也不麻烦,主要在于数据需要处理好,后续一些样式的配置我们可以参考Echarts官方示例;
同样需要添加我们机场的位置信息,这部分处理与上面机场图一致;
另外就是添加航线的数据,我这边是写了一个循环,依次添加每个航司的航线数据。
GEO-LINES图需要的数据格式类似于[[from, to], [from, to]...[from, to]],处理好的数据放在data_pair中暂存,添加到GEO中再清空,再依次缓存下个航司的航线数据。
def flights_line_viz(airports_data, route_data):
    geo = Geo(init_opts=opts.InitOpts(theme='dark', bg_color='#000000', width='1980px', height='1080px'))

    # 添加机场的坐标点
    for idx, item in enumerate(airports_data):
        geo.add_coordinate("airports" + str(idx), item[3], item[4])

    geo.add_schema(
        maptype="world",
        is_roam=False,
        zoom=1.1,
        itemstyle_opts=opts.ItemStyleOpts(color="#000000", border_color="#1E90FF"),
        emphasis_label_opts=opts.LabelOpts(is_show=False),
        emphasis_itemstyle_opts=opts.ItemStyleOpts(color="#323c48")
    )

    idx = route_data[0][0]
    data_pair = []
    for item in route_data:
        if item[0] == idx:
            data_pair.append(["airports" + str(item[1]), "airports" + str(item[2])])
        else:
            geo.add(airlines[idx][0],
                    data_pair,
                    type_='lines',
                    is_selected=True if airlines[idx][0] == 'Air China' else False,
                    symbol_size=1,
                    is_large=True,
                    large_threshold=1e6,
                    progressive_threshold=100000,
                    linestyle_opts=opts.LineStyleOpts(curve=0.2, opacity=0.03, color='#1E90FF', width=0.2),
                    effect_opts=opts.EffectOpts(symbol='pin', period=5, symbol_size=2, trail_length=0.5,
                                                color="#E1FFFF"),
                    )
            data_pair = []
            idx = item[0]

    geo.set_series_opts(label_opts=opts.LabelOpts(is_show=False))

    geo.set_global_opts(
        title_opts=opts.TitleOpts(title="航线图", pos_top='3%', pos_left='center'),
        tooltip_opts=opts.TooltipOpts(is_show=False),
        legend_opts=opts.LegendOpts(is_show=True, pos_left='left', pos_top='50%', orient='vertical',
                                    selected_mode='single')
    )

return geo调用以上的两个方法都是返回的pyecharts图表实例,通过.render()方法生成HTML文件。
if __name__ == "__main__":
    charts = airports_viz(airports)
    charts.render('airports.html')

    charts = flights_line_viz(airports, routes)
    charts.render('flights_line.html')
