 Logging is one of the most important parts of software systems. Whether you have just started working on a new piece of software, or your system is running in a large scale production environment, you’ll always find yourself seeking help from log files. Logs are the first thing people look for when something goes wrong, or something doesn’t work as expected.
 The similarities and differences between monitoring and observability and how to pair the two strategies
 How to create a construct based on other constructs in the same stack without forcing the developer to call a method for each? That's exactly what aspects do!
 Technology touches almost every corner of the world economy. Even when it’s an indirect relation, in many cases tech is an essential, vital part of our societies. It just can’t fail without causing too much distress and losses. Not only financially, but especially to the human aspect.
 The observability industry is projected to grow about 8% in 2023, a continuation of a strong growth trend since the 90’s.
 Rapid prototyping tips when using Grafana and Prometheus observability and monitoring stack.
 please delete this
 Rookout Co-Founder and CTO, Liran Haimovitch, shares the origin story of their debugging tool, what excites him about the startup life, PLG, and more.
 Monitoring has been a basic system to track the health of servers for years. Now it is not enough.
 Learm how a serverless monitoring solution can catch problems for you without the painful learning curve connected to serverless failure detection.
 If you ever find yourself deciding for or against serverless the following tries to make the decision easier for you.
 2022 saw the data space grow by leaps and bounds. Here are the top 9 things our team of data experts expects to see in 2023.
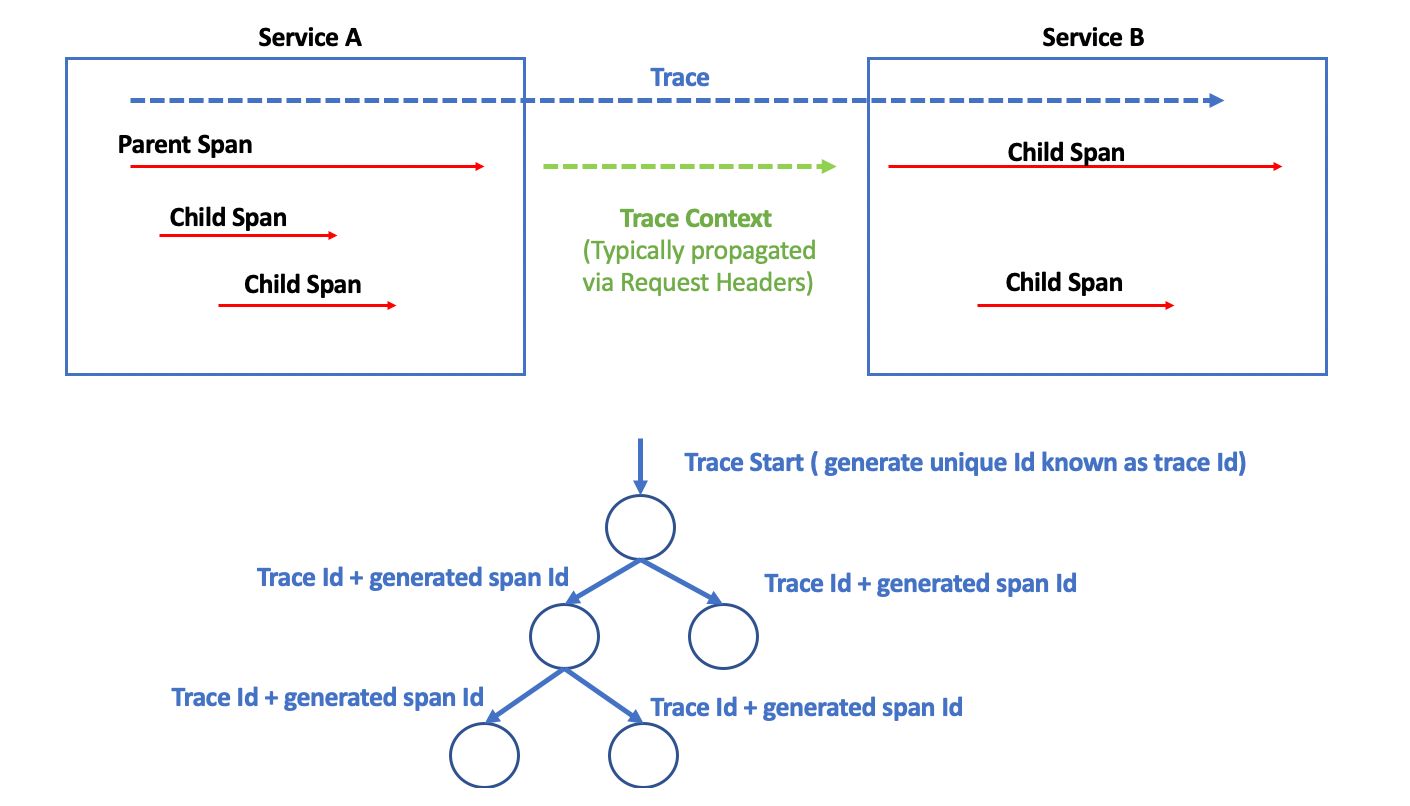
 In this article, I am going to shed light on one important aspect of observability - tracing.
 Debugging AWS Lambda can get tricky in Amazon CloudWatch. KloudMate lets you get to Lambda errors quickly and effectively using Lambda error logs.
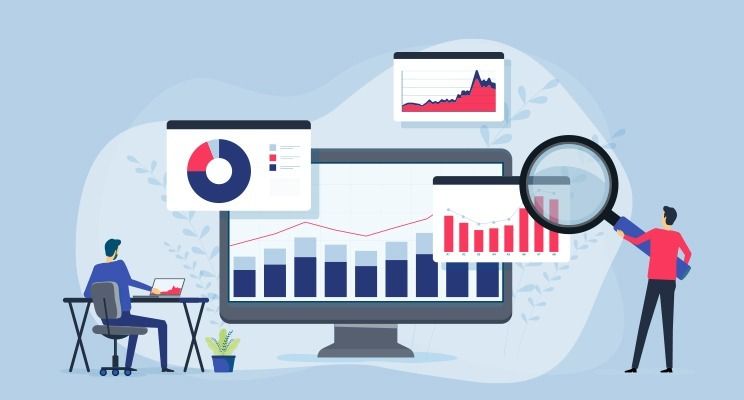 Observability vs. monitoring, what is the difference? Monitoring is the what to observability’s why. Here we dig into the differences.
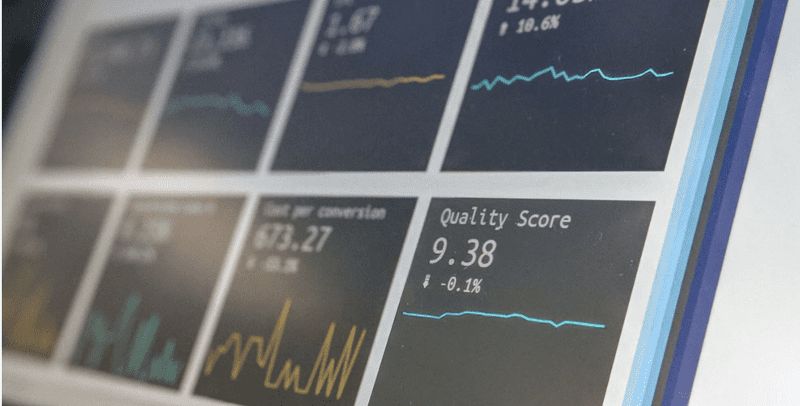 Should you increase Lambda memory? It might sound crazy, but increasing your AWS Lambda memory could actually lower your bills. Find out how.
 End-to-end full observability using Odigos and other back-end observability tools.
 A guide to understanding the concepts and differences between monitoring and observability.
 Everyone is familiar with CI and CD processes, but whatever happened to Continuous Feedback? Leveraging observability in dev creates a new type of dev process
 In this article, I want to describe how to work with logs, analyze them in the command line, and we will consider new modern tools to visualize logs.
 We trust our metrics to show us the status of our system and where it misbehaves. But do our metrics show us what really happened?
 You are reading this content, which means that you are not novice to the microservices field. So let me just scratch the surface of it before moving to Observable Microservices. Once upon a time Monolith Application was now transformed into Microservices based application.
 Engage in intelligent change.
 A truly "blameless culture" in software must to evolve from incident reporting, to telemetry aimed at Proactive Observability in DevOps
 Apache Flink monitoring support is now available in the open source OpenTelemetry collector.
 rsyslog vs journald vs filebeat
 The 2022 State of Logs Report provides a detailed view of how this practice is shaping engineering and the technologies of the future.
 OpenTelemetry is young, even by internet standards. Born out of the merger of OpenTracing and OpenCensus projects at the Cloud Native Computing Foundation CNCF
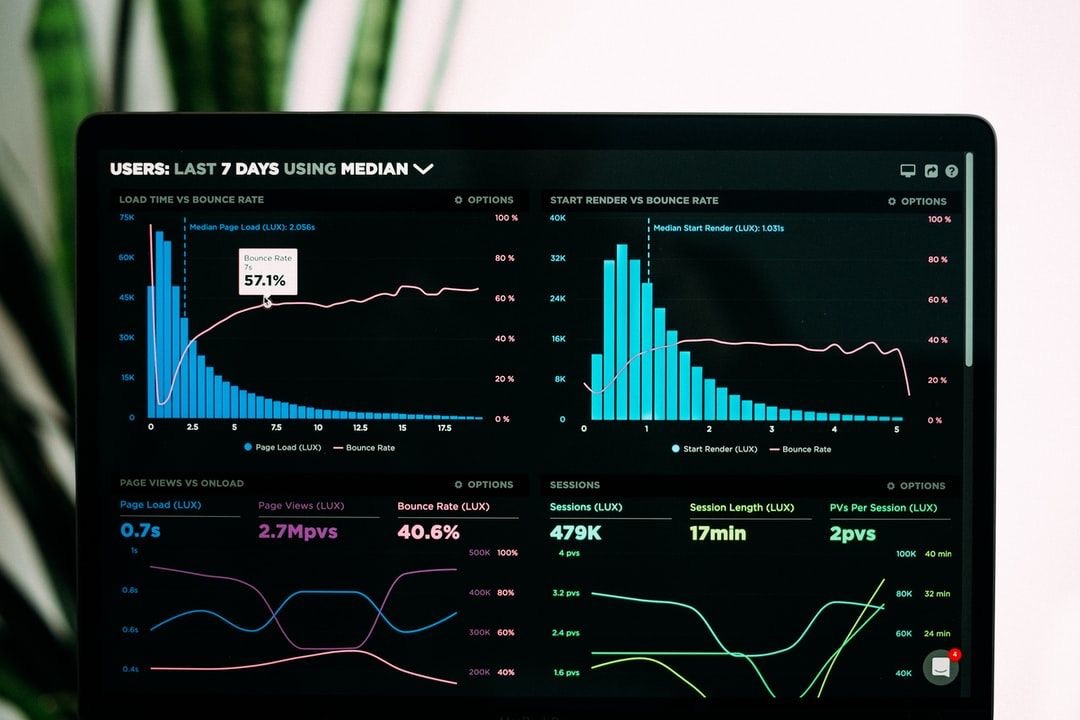 Which application metrics should you collect for your microservices?
 Piece by piece, legacy monolith applications are being broken down and replaced by microservices.
 Observability is a best practice implemented by AIOps, enabling automation and expanding visibility into the entire organizational ecosystem.
 An article focused on deep diving into observability and its significance in software. Its history, goals, the importance of observability, and the issues that
 Running systems in production involve requirements for high availability, resilience and recovery from failure. When running cloud-native applications this becomes even more critical, as the base assumption in such environments is that compute nodes will suffer outages, Kubernetes nodes will go down and microservices instances are likely to fail, yet the service is expected to remain up and running.
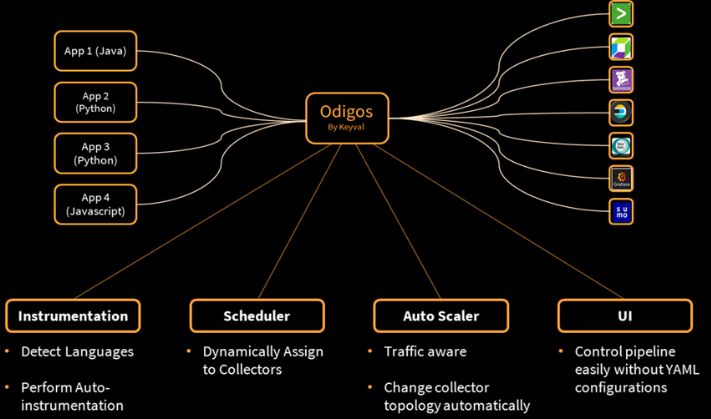 Without proper implementation and continuous configuration of your collectors, observability tools will be limited at best at best and many times ineffectual.

 In this post, we’re going to look at what API reconstruction is and how APIClarity solves the API observability problem.
 Sidekick is a live application debugger that lets you troubleshoot your applications while they keep on running. Here is how you can start using it in 5 minutes
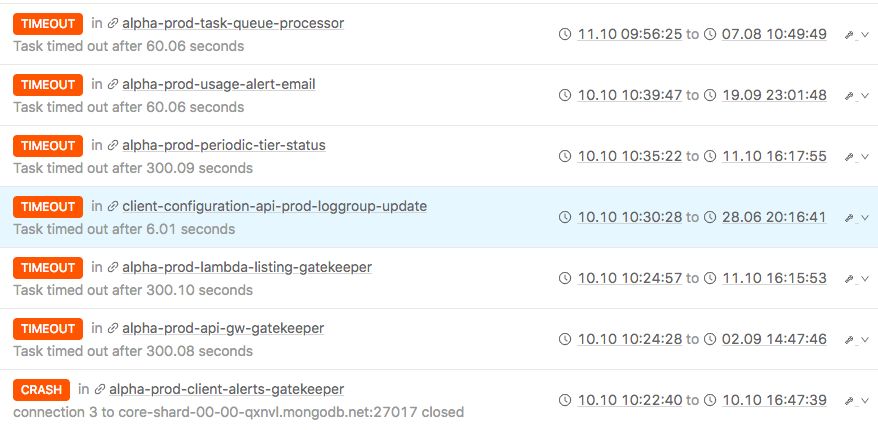 Having reliable failure detection in place is a must for any application in production. Here's how to best achieve it for AWS Lambda.
 Observability is a hot term in the industry, but don’t let it fool you: having visibility into your organization's apps and services only gives you a piece.
 In order to leverage observability we need a significant shift in our corporate culture that encapsulates the entire company & goes beyond the tools.
 By building observability and analytics into your notification system, you can identify and quickly resolve issues by monitoring how your product is performing.
 Collecting wide swaths of observability and security data is key to a high-quality digital experience. Find out what you need to know to get started.
 This post was written by Dean Record, Engineer at Goji Investments.
 It turns out that, by rethinking the fundamentals of your approach to monitoring, you can have it all
 Part One: ClickHouse Failures, by Marcel Birkner
 Cloud platforms like Heroku make it easier than ever to host applications: just upload your code, and they’ll deploy it for you. But a common misconception is that, because you don’t own the infrastructure, you can’t really monitor your applications or see under the hood.
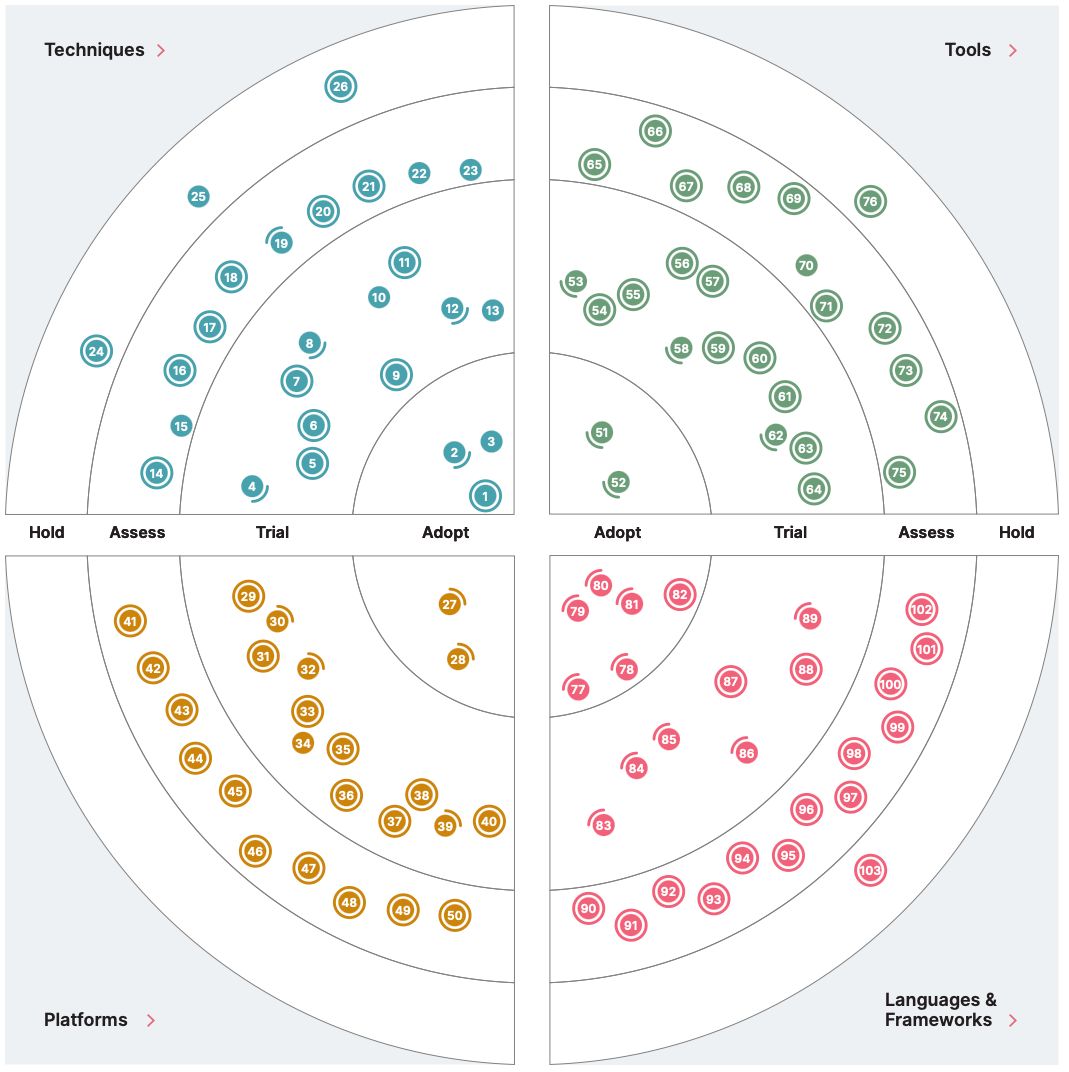 Thoughtworks’ Technology Radar is a regular time to take a look at what trends are changing our industry.
 It’s tough, impossible, to get a holistic view of your entire application when it’s running on 200 pods deployed to 12 nodes distributed across the world.
 Despite tight economic situations worldwide, the API economy continues to grow.
 A year ago, Harry Bagdi wrote an amazingly helpful blog post (link at bottom of article) on observability for microservices. And by comparing titles, it becomes obvious that my blog post draws inspiration from his work.
 Running any application in production assumes reliable monitoring to be in place and serverless applications are no exception.
 To create amazing cloud native applications your platform needs these components: Kubernetes, Continuous Delivery Pipelines, Edge Stack, and Observability. This article will explain the importance of each component.
 Cloud computing is becoming more and more of a household name, with even the most conservative fields of business figuring out how to make the best use of it. Cloud computing usually starts with running a private cloud solution on premises before venturing onto the public cloud. Of course, the cloud is not a single uniform being. It may come from different providers, Amazon Web Services, Google Cloud Platform, and Microsoft Azure being the biggest players here. Or it may come with different visibility and hosting, that is, public (resides with the provider), private (self-hosted), or hybrid (which uses a bit of both). And the cloud can use different tools and APIs for management as well.
 Managing applications at scale often comes up as one of the biggest concerns for businesses; How can it work smoothly? How do we monitor so many resources? How do we maintain best practices with constantly evolving infrastructure? In this article, we run through the best approach for operational excellence looking at serverless monitoring strategy, serverless alerting strategy, and security and compliance best practices.
 In my previous article, I talked about the importance of logs and the differences between structured and unstructured logging. Logs are easy to integrate into your application and provide the ability to represent any type of data in the form of strings.

 APIs are the blood vessels of digital business.
 Monitoring vs Observability: in this article, we're explaining what is observability exactly and how does it differ from monitoring.
 Learn about the best practices for AWS Cloudwatch Alerts and Dashbird Alarms, to not miss out on critical info about your serverless app.
 A distributed architecture brings in several challenges when it comes to operability and monitoring. Here, one may be dealing with tens if not hundreds of microservices, each of which may or may not have been built by the same team.
 Gone are the days when operations and development were a back-office affair.
 Setting up a Prometheus server can be easy, but getting actionable information out is a very long and never-ending journey.
 Monitoring is a crucial part of observability. Learn how monitoring can specifically improve security, performance, and reliability.
 The “Lambda configuration error” is as generic as it gets but at the end of the day, it's a pathing issue. Let's go over how to resolve this.
 This post will introduce the idea of Lua-land CPU flame graphs and use OpenResty XRay to produce real flame graphs for several small and standalone Lua examples
 Learn the common pitfalls of moving to the cloud and how you can avoid them to truly benefit from the cloud’s elasticity.
 An alternative logging strategy to make loggers your friends, not enemies
 Logs, metrics, and traces are the three pillars of the Observability world. The distributed tracing world, in particular, has seen a lot of innovation in recent months, with OpenTelemetry standardization and with Jaeger open source project graduating from the CNCF incubation.
 A common architectural design pattern these days is to break up an application monolith into smaller microservices. Each microservice is then responsible for a specific aspect or feature of your app. For example, one microservice might be responsible for serving external API requests, while another might handle data fetching for your frontend.
 The easiest way to map our cluster: Caretta - a standalone OSS tool, leveraging eBPF technology to be lightweight and frictionless
 If you want to access data in a distributed environment such as in a microservice architecture, then data services are the way to go. The idea is to create a data abstraction layer (DAL) that the rest of the system’s applications and services can share. Thus, a data service gives you a generalized interface to the data you’re exposing and provides access to it in a standard manner. This would be in a well-understood protocol and a known data format. For example, a popular approach is to use JSON via HTTP/S.
 Our guide in creating FastAPI abstraction that allows us to query the AWS Glue metadata catalog - a Data Discovery API for AWS Data Lake.
 In this article, we first explain the requirements for monitoring your big data analytics pipeline and then we go into the key aspects that you need to consider to build a system that provides holistic observability.
 Introduction


