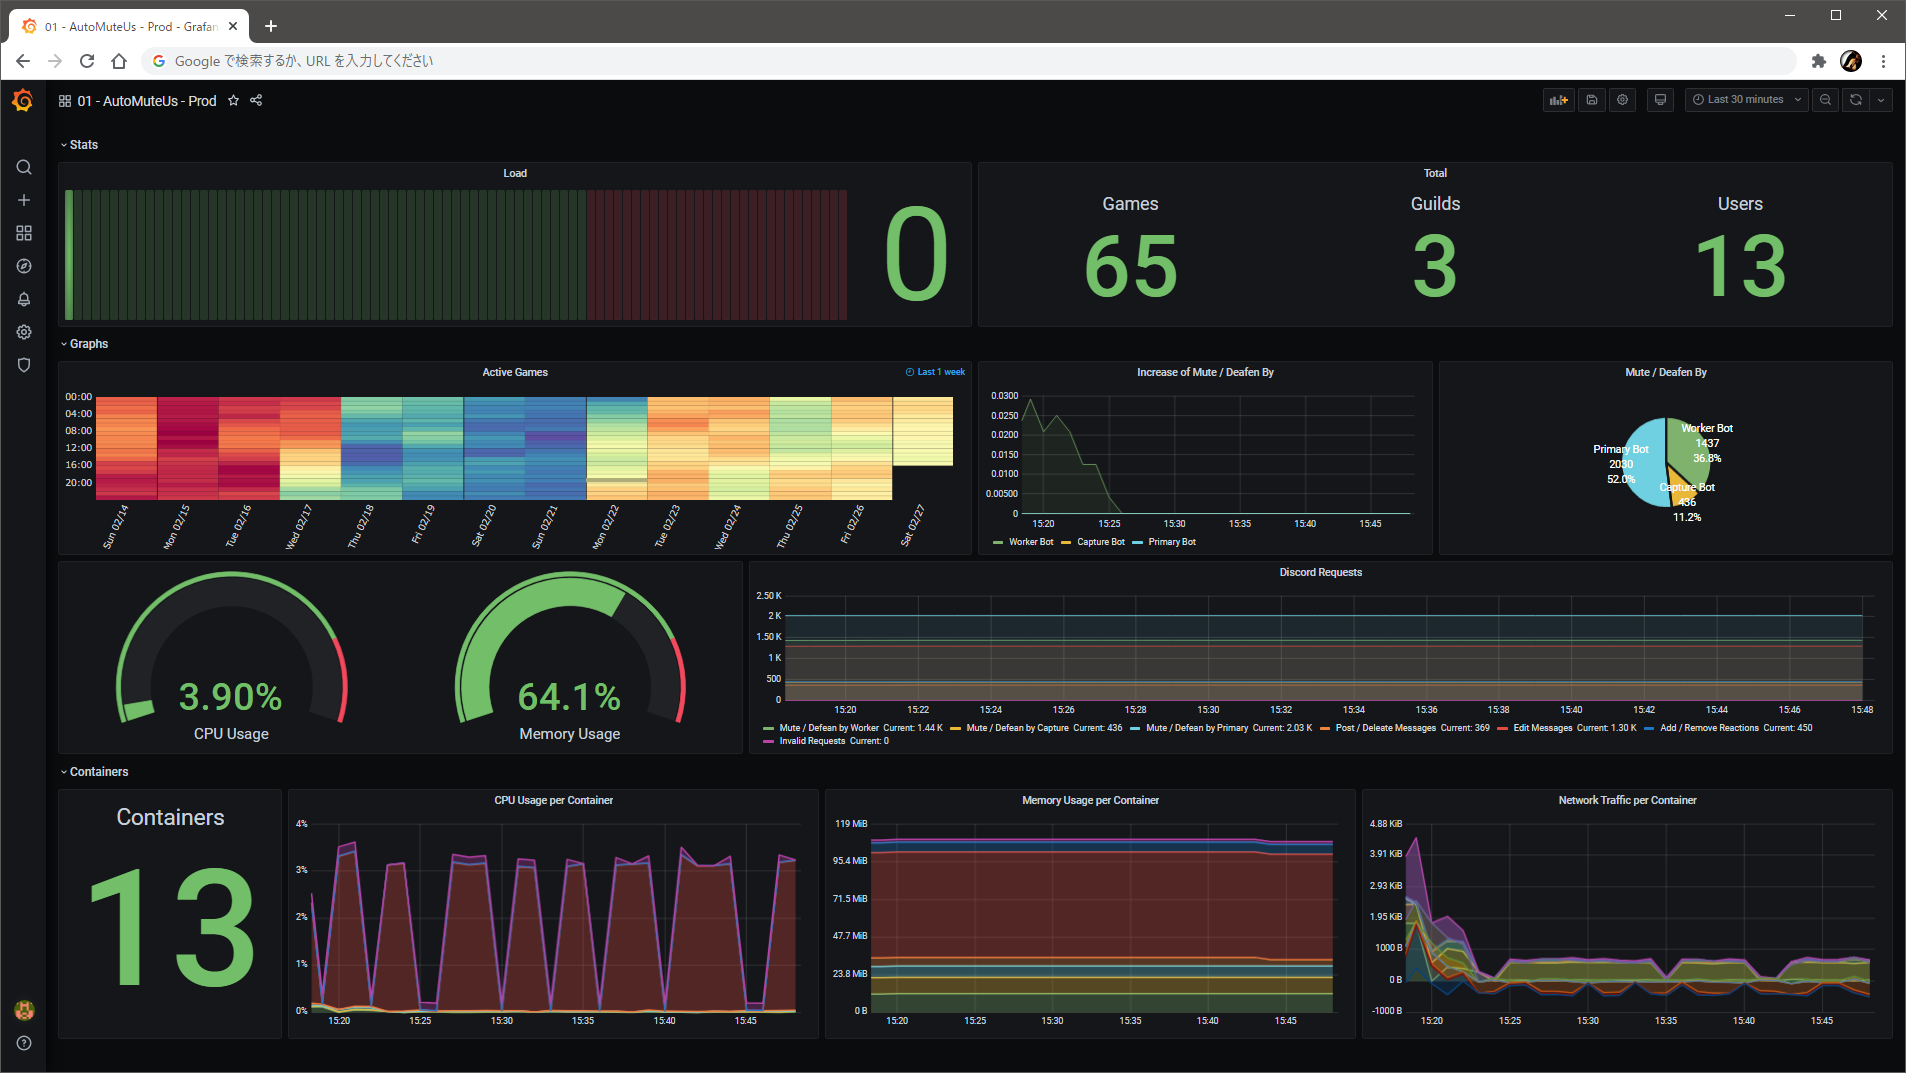
This is an example of AutoMuteUs with pre-configured Grafana dashboard in easy way. All information will be aggregated in Prometheus automatically.
Create your .env file using sample.env in this repository as in the official procedure. This sample.env contains additional configuration for Grafana and Prometheus.
# Change these for prometheus and grafana dashboard.
# For the *_TAG, refer followings and specify the latest versions without the leading "v".
# Note that Node exporter and cAdvisor are required only for full-featured version.
# - Grafana: https://github.com/grafana/grafana/releases
# - Prometheus: https://github.com/prometheus/prometheus/releases
# - Json exporter (used as Galactus exporter): https://github.com/prometheus-community/json_exporter/releases
# - Node exporter: https://github.com/prometheus/node_exporter/releases
# - cAdvisor: https://github.com/google/cadvisor/releases
GRAFANA_TAG=9.3.6
PROMETHEUS_TAG=2.42.0
PROMETHEUS_AUTOMUTEUS_EXPORTER_TAG=0.5.0
PROMETHEUS_DOCKER_NODE_EXPORTER_TAG=1.5.0
PROMETHEUS_CADVISOR_TAG=0.47.0

# Specify default username and password for Grafana
GRAFANA_USER=admin
GRAFANA_PASS=Grafana123!
GRAFANA_EXTERNAL_PORT=3000
Now all you have to do is just start it. If you want to use full-featured version that includes the information from your Docker host (i.e. CPU load per Container, etc.), use docker-compose.full.yml instead.
# Start standard version.
docker compose up -d

# Start full-featured version.
# To use this, you need to specify the name of the compose file by -f option
# not only when invoke "up" but also any other operations i.e. "ps", "logs", "down", etc.
docker compose -f docker-compose.full.yml up -d
Within a few minutes, you can view Grafana at: http://<your-docker-host>:3000/.
Once you logged in, now you can access pre-configured dashboard named AutoMuteUs from the Dashboards > Browse menu on the left. It may take a few minutes for the values to actually start showing up.
If you are using full-featured version on the Docker running on CentOS, Fedora, or RHEL, there is a possibility that it will fail to start. This is due to the limitations of cAdvisor, which is used to gather information about your container host.
If this happens, uncomment the following lines for the prometheus-cadvisor service in the docker-compose.yml file.
    volumes:
      - /:/rootfs:ro
      - /var/run:/var/run:rw
      - /sys:/sys:ro
      - /var/lib/docker/:/var/lib/docker:ro
      # If you want to run this container on CentOS, Fedora, or RHEL,
      # an additional mount for /cgroup is required.
      - /cgroup:/cgroup:ro
    # And privileged mode is also reqired for CentOS, Fedora, or RHEL.
privileged: trueThe collected data will be stored in a time series database in Prometheus. The data will be retained for 15 days according to Prometheus default.
The data will be persisted in the persistent volume named prometheus-data.
To reduce unnecessary resource consumption, data is collected every 60 seconds, more spaced out than the default.
AutoMuteUs has built-in Prometheus collector using port 2112 by default. So we can simply scrape this endpoint.
  - job_name: discord_stats
    static_configs:
      - targets:
          - automuteus:2112
    metrics_path: /metrics
This provides some values about Discord API requests like which types of bots has used to mute / deafen users.
By querying Galactus broker using HTTP, we can get a JSON strings including some statistics. So we can scrape this JSON strings using Json exporter.
  - job_name: automuteus_stats
    metrics_path: /probe
    static_configs:
      - targets:
          - http://galactus:8123/
    relabel_configs:
      - source_labels: [__address__]
        target_label: __param_target
      - source_labels: [__param_target]
        target_label: instance
      - target_label: __address__
replacement: prometheus-automuteus-exporter:7979This is achieved by Node exporter and cAdvisor.
  - job_name: docker_node_stats
    static_configs:
      - targets:
          - prometheus-docker-node-exporter:9100

  - job_name: docker_container_stats
    static_configs:
      - targets:
          - prometheus-cadvisor:8080
The Node exporter needs to have access to a different namespace to get all the information, but allowing this may unintentionally expose ports to the outside world.
For this reason, in this Compose file, lots of metrics are disabled to limit the permissions to the same level as normal containers.
  prometheus-docker-node-exporter:
    image: quay.io/prometheus/node-exporter:v${PROMETHEUS_DOCKER_NODE_EXPORTER_TAG:?err}
    command:
      - --path.rootfs=/host
      - --collector.disable-defaults
      - --collector.cpu
      - --collector.filesystem
      - --collector.meminfo
    volumes:
      - /:/host:ro,rslave