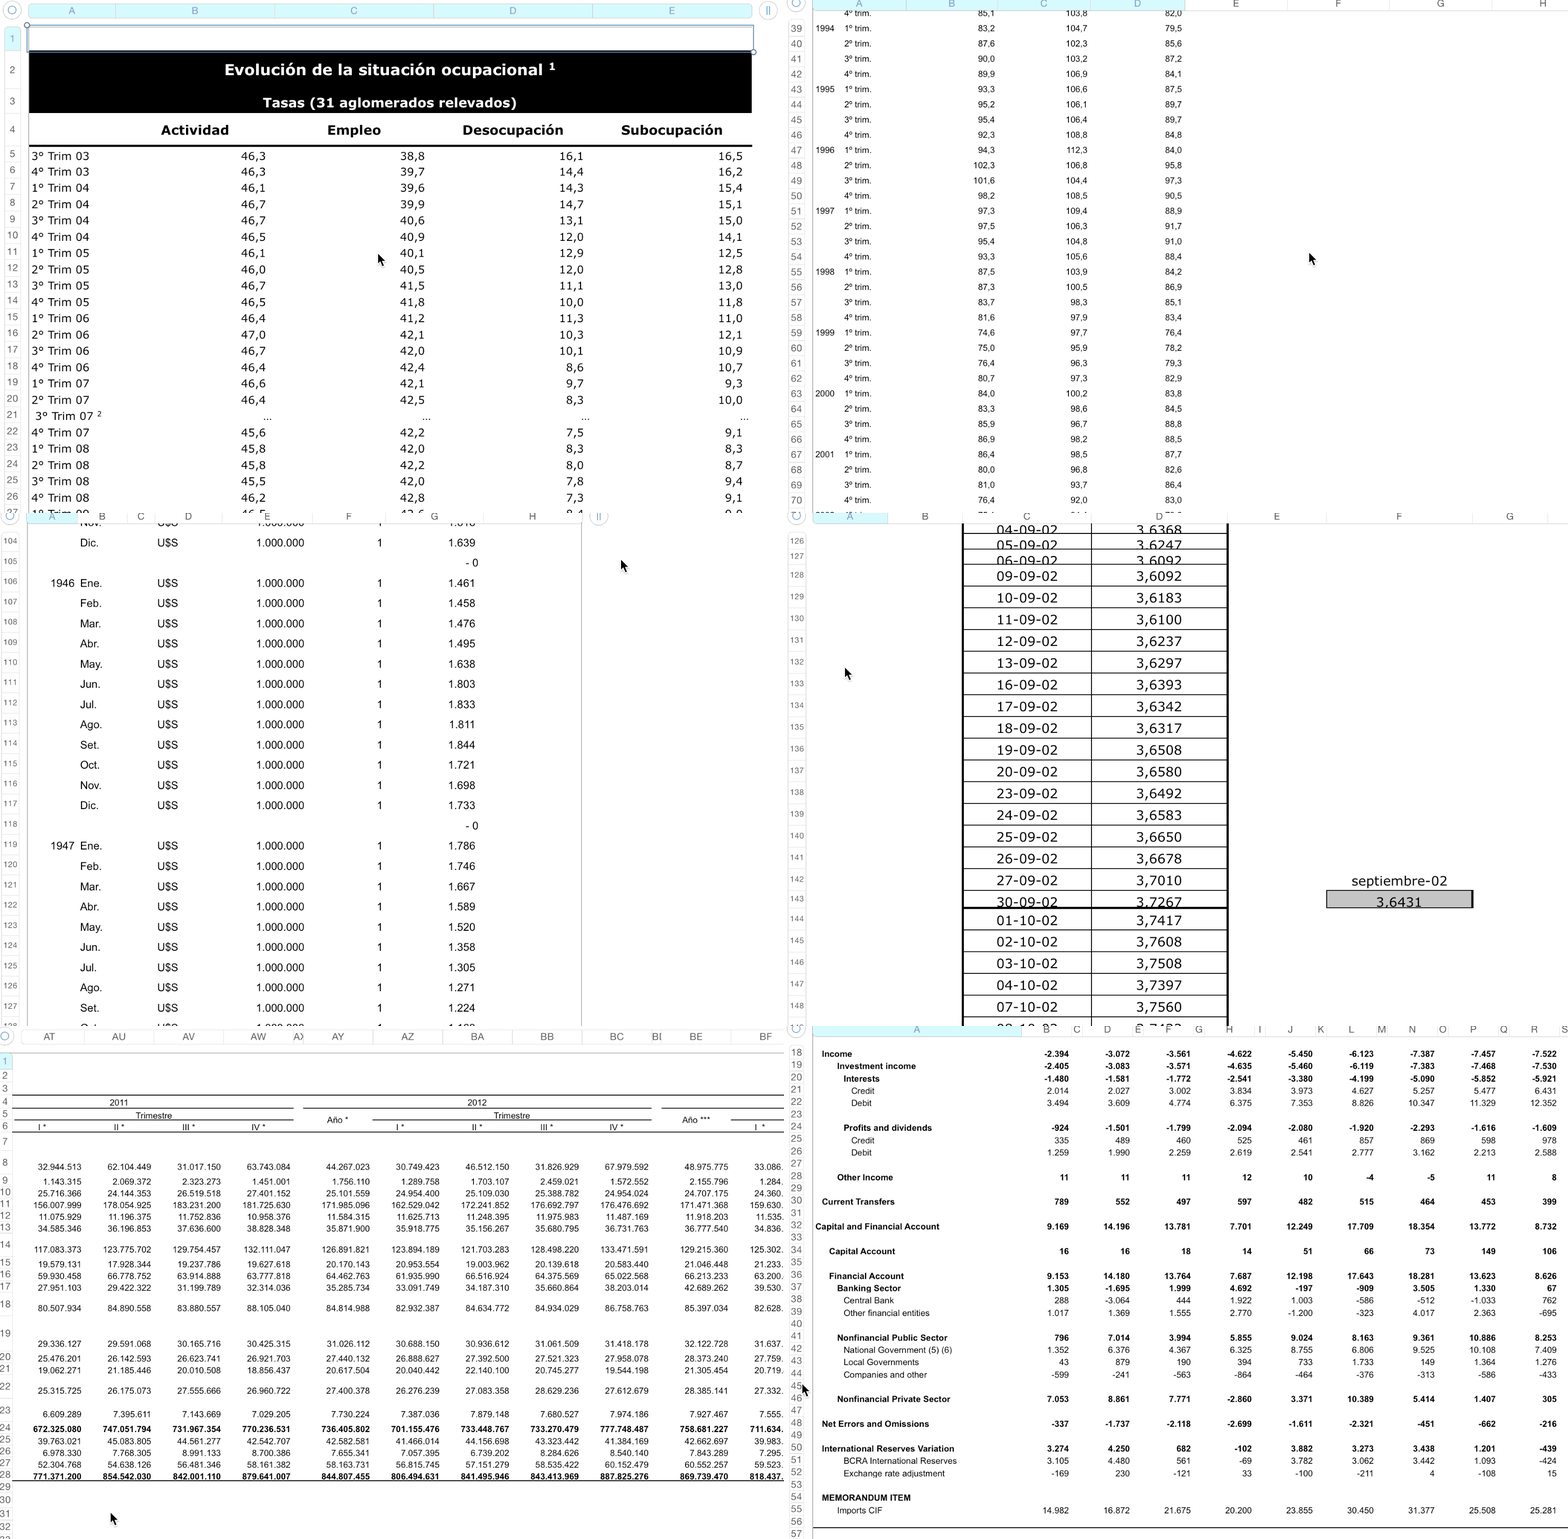
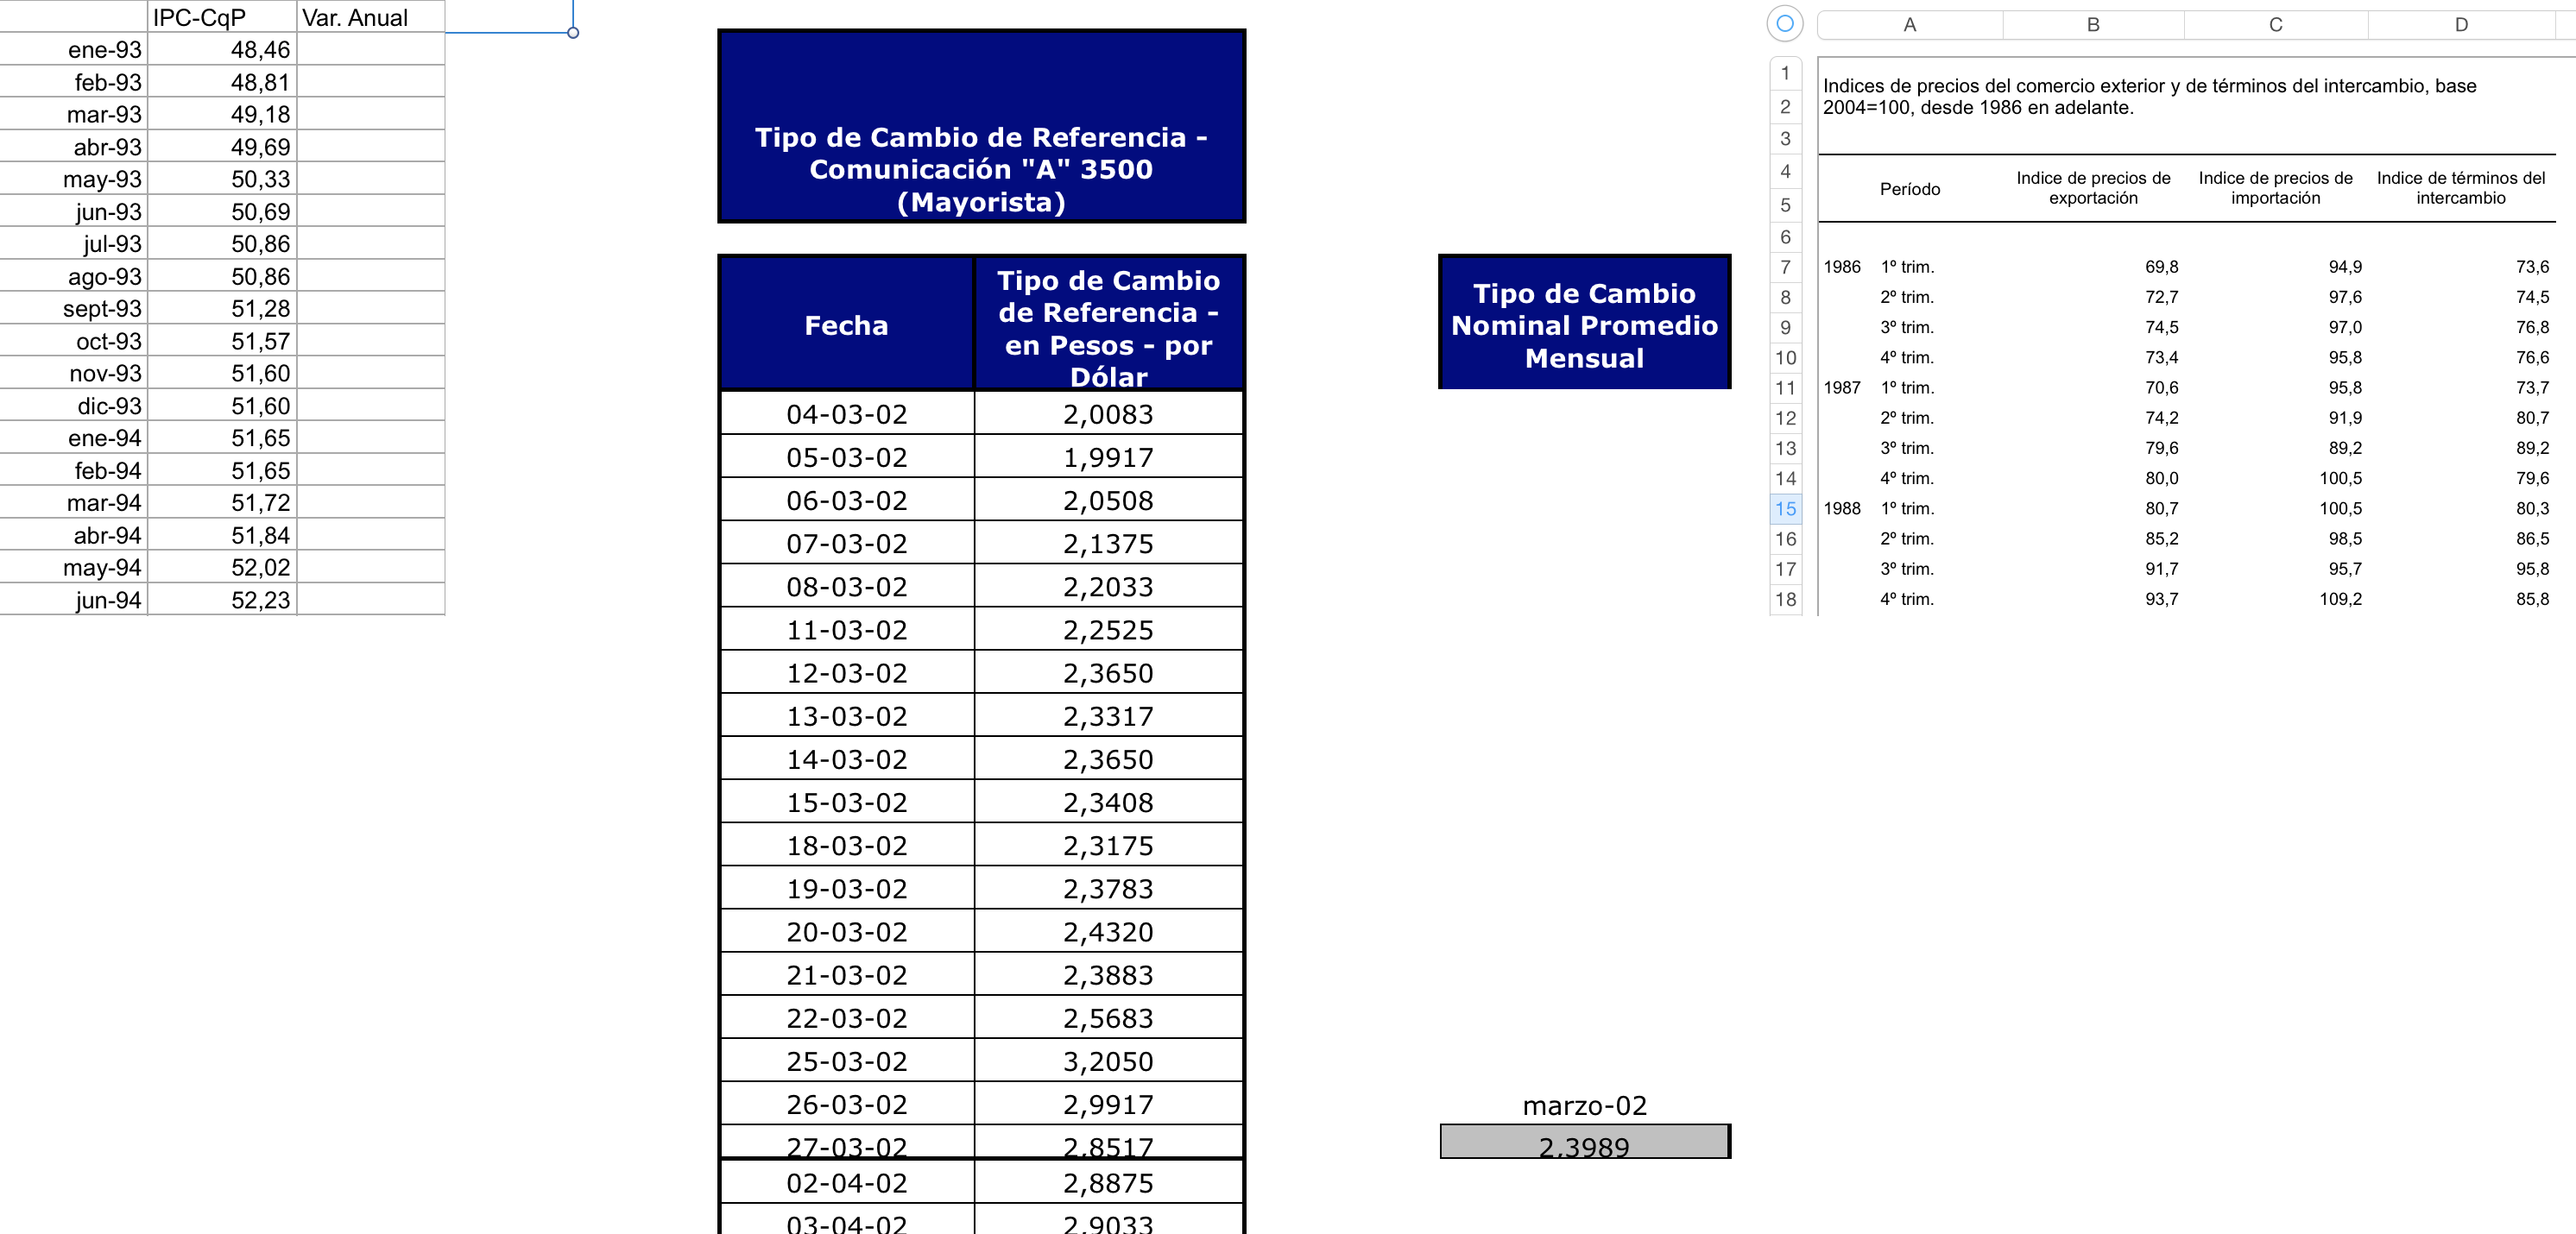
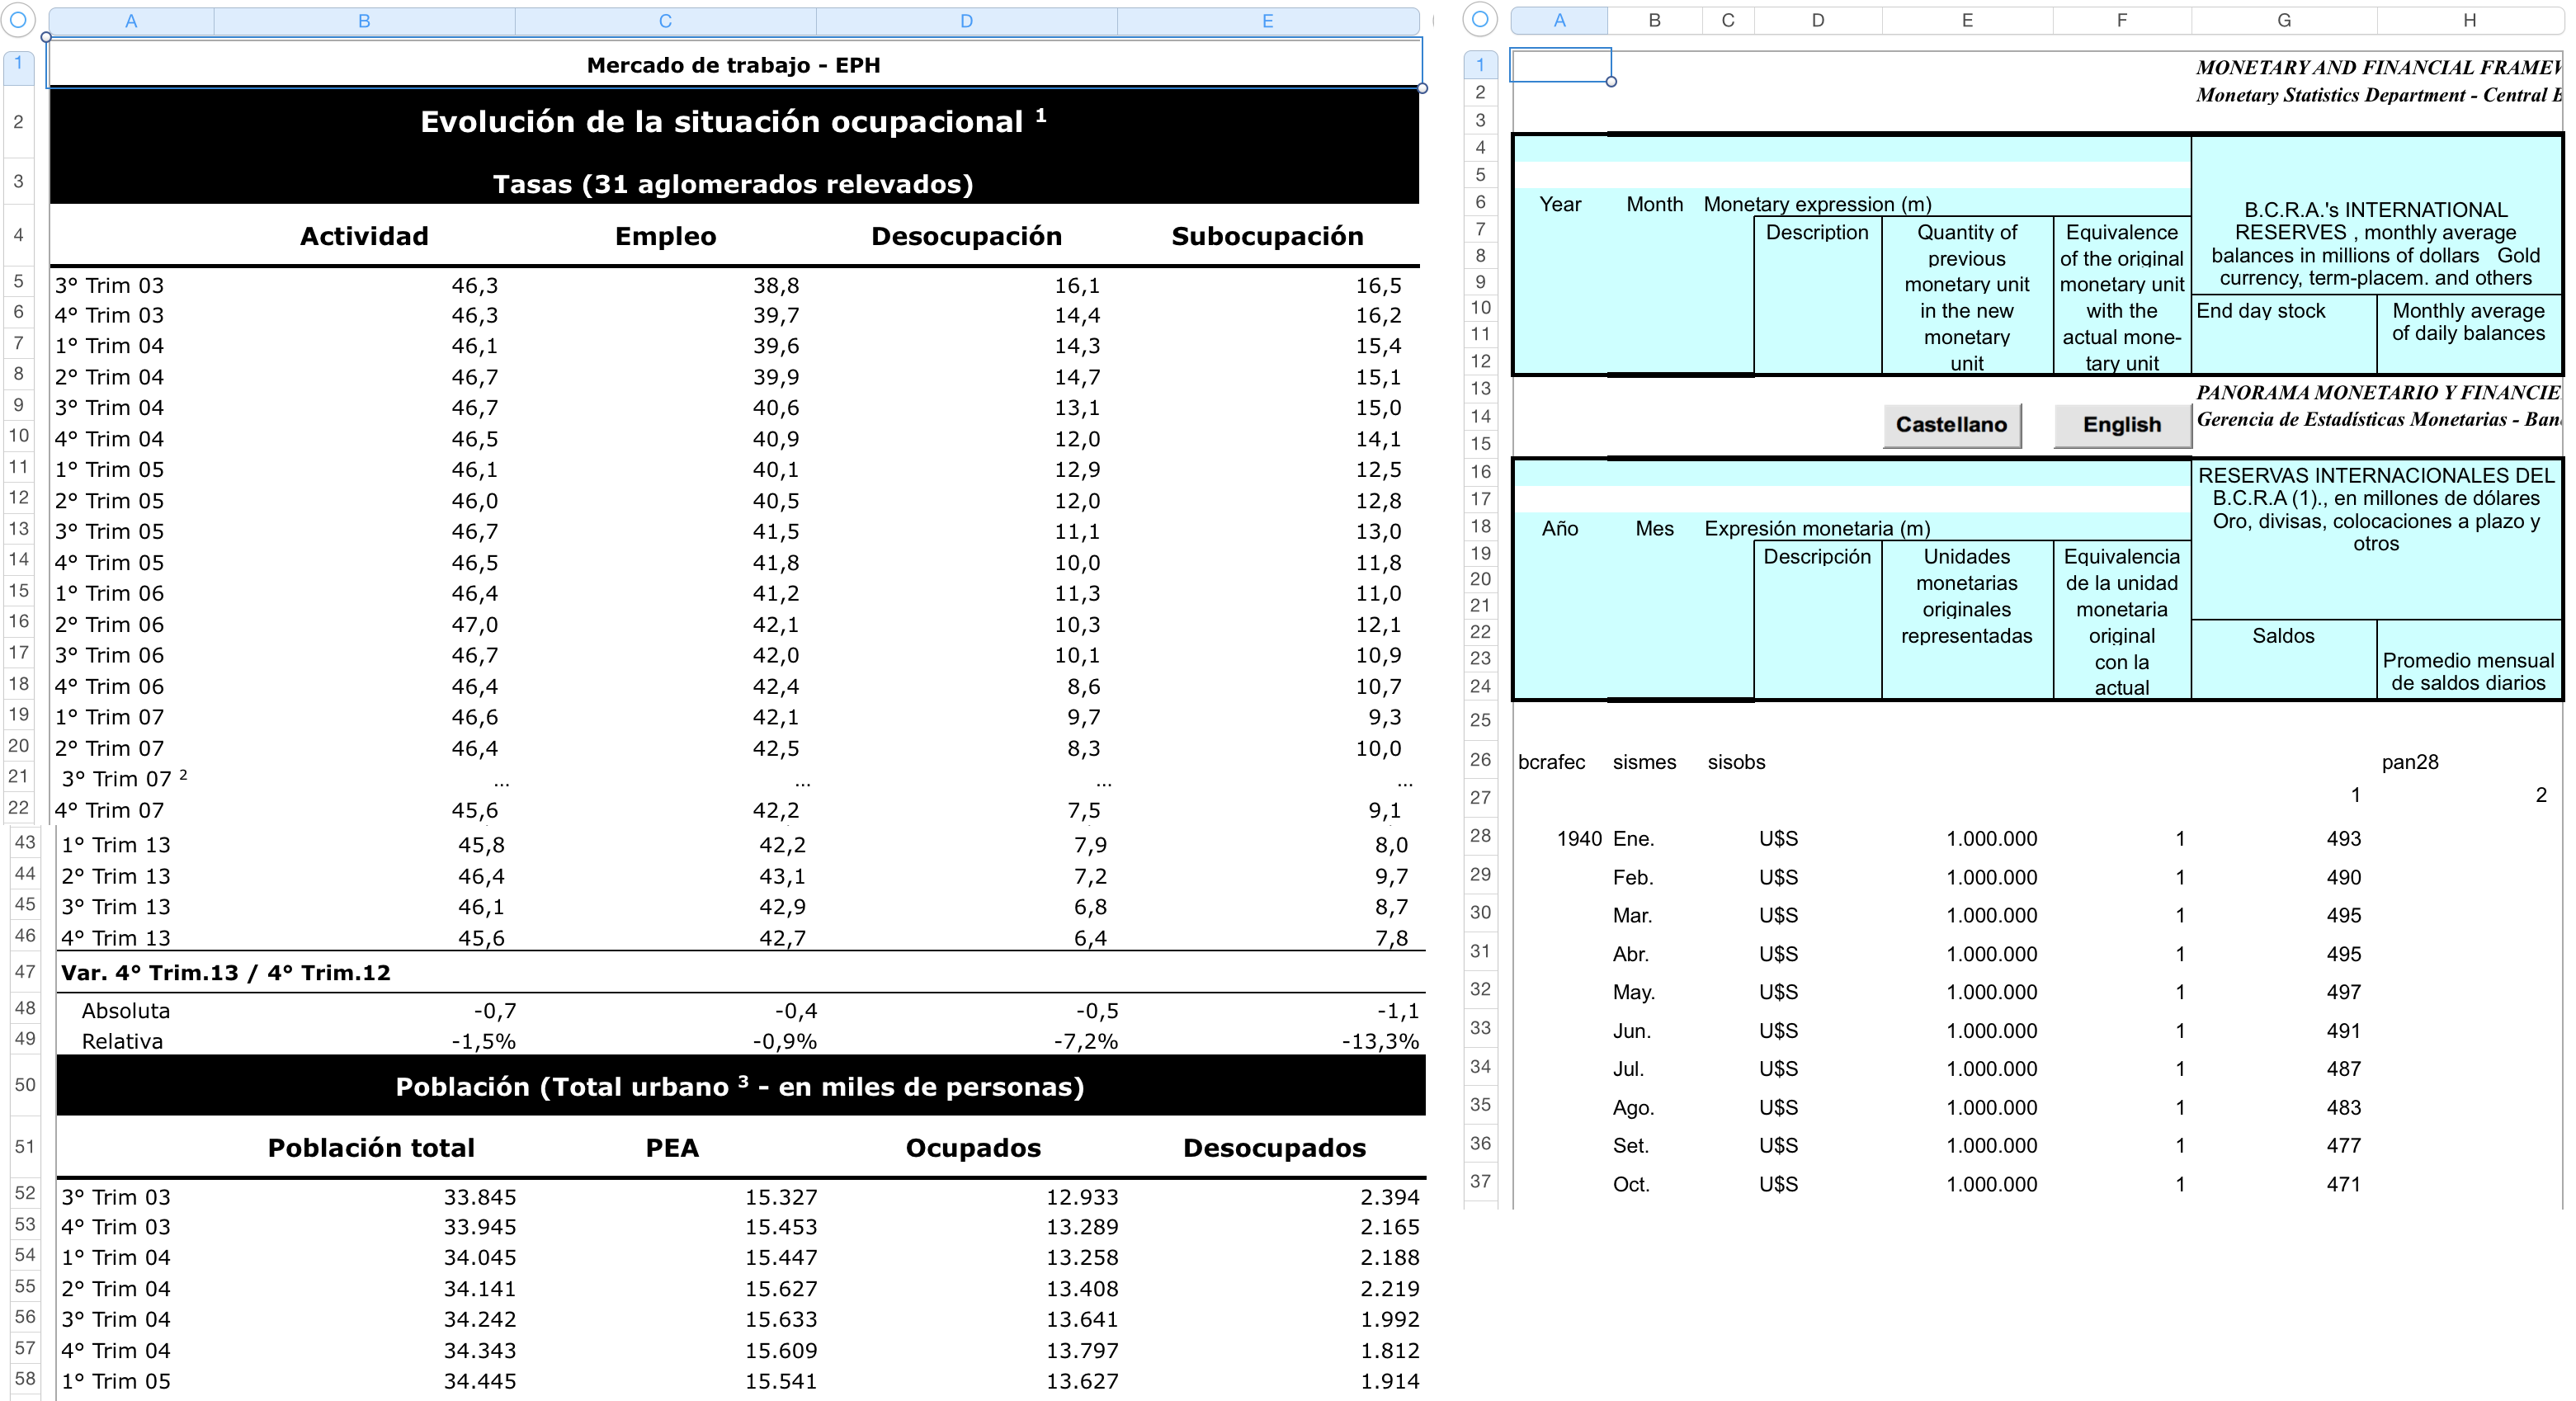
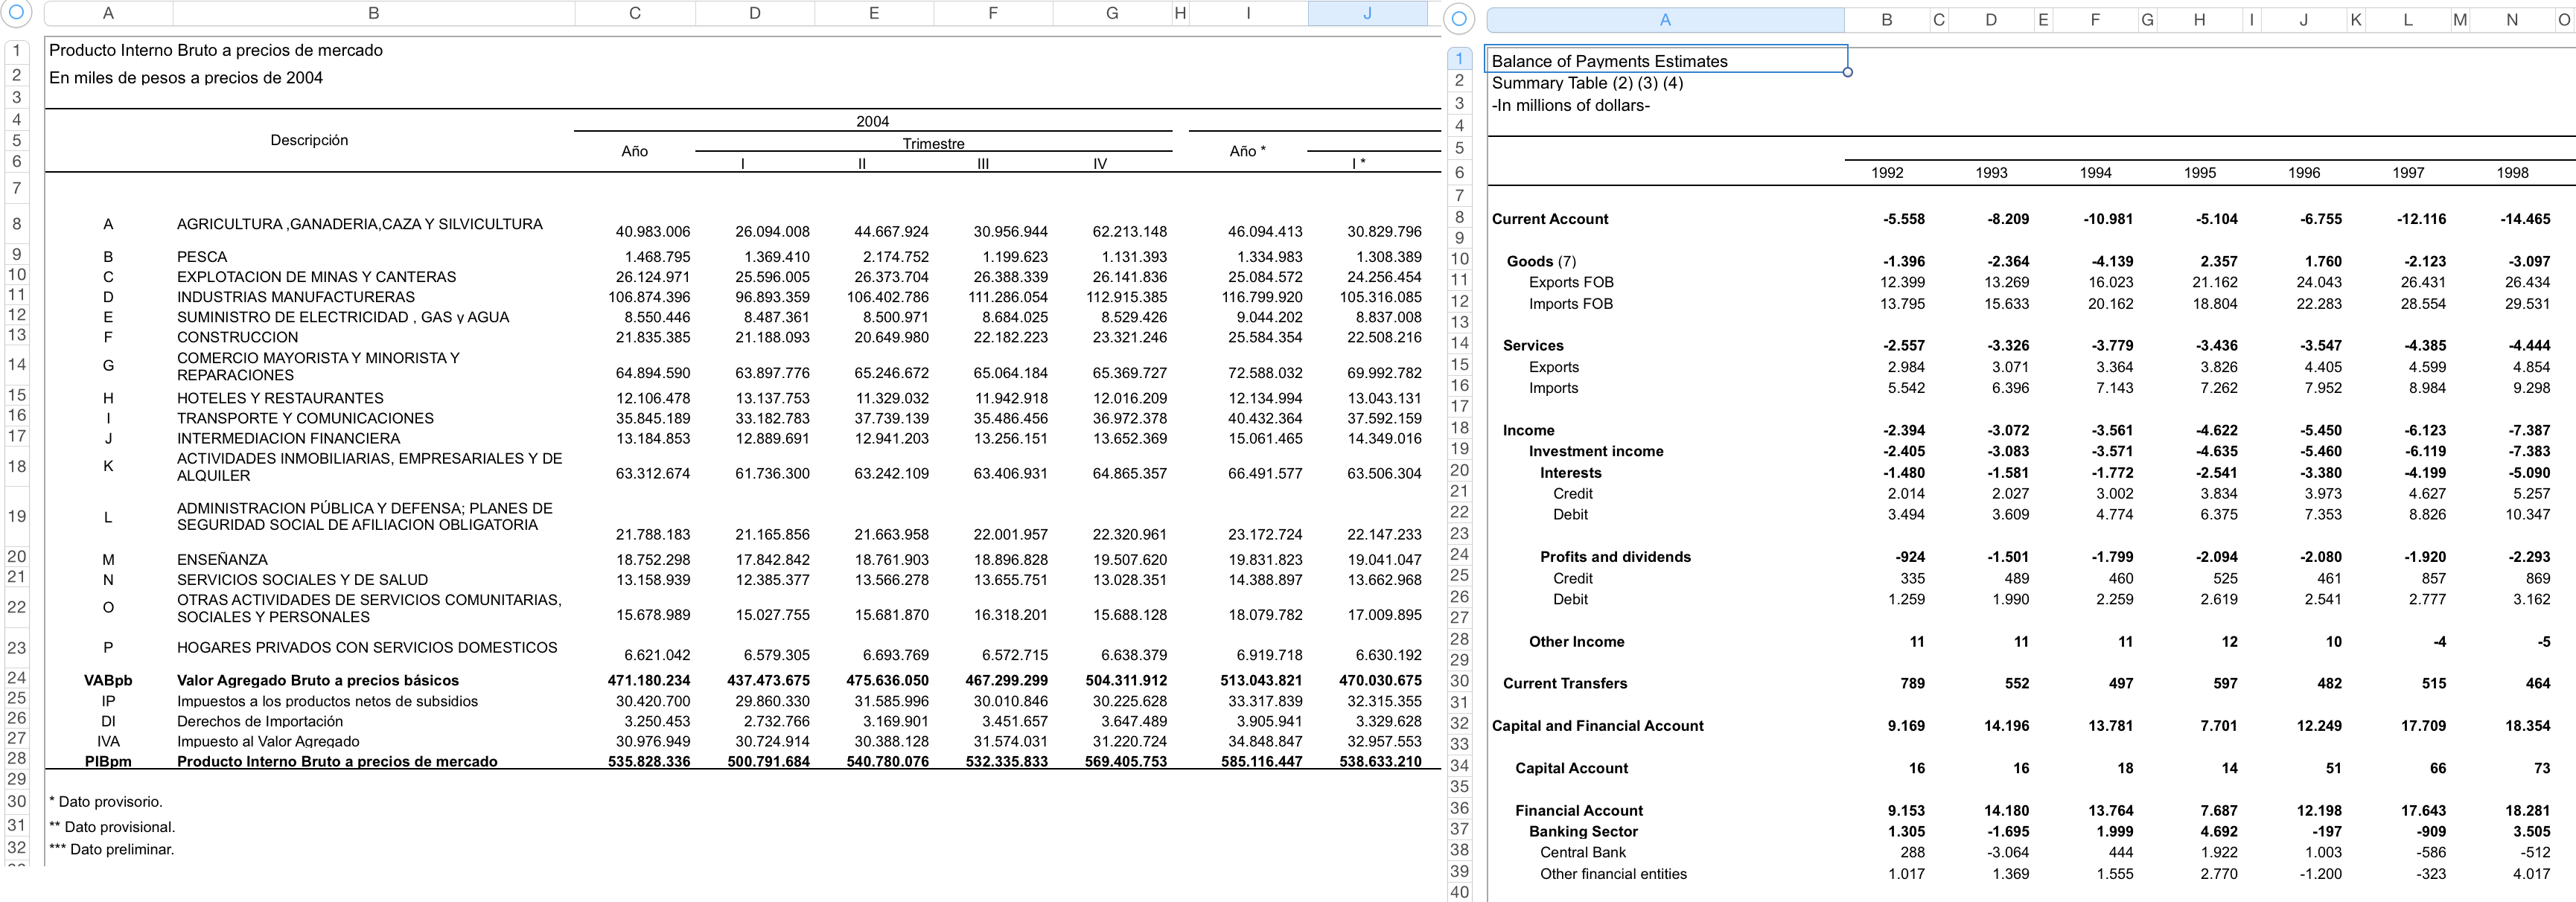
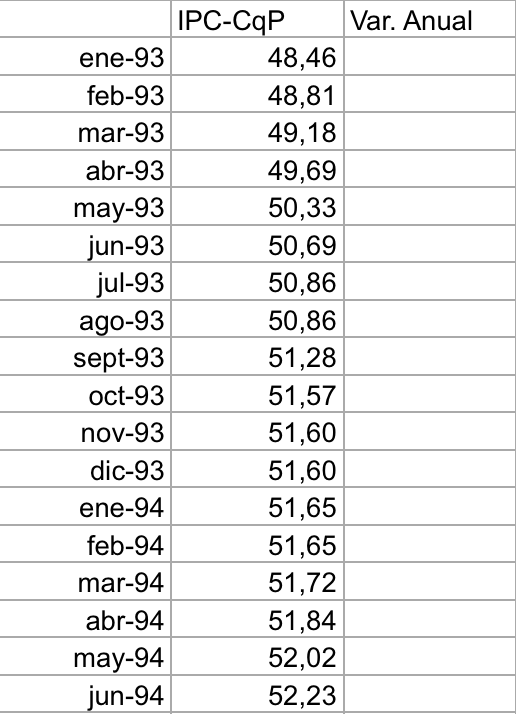
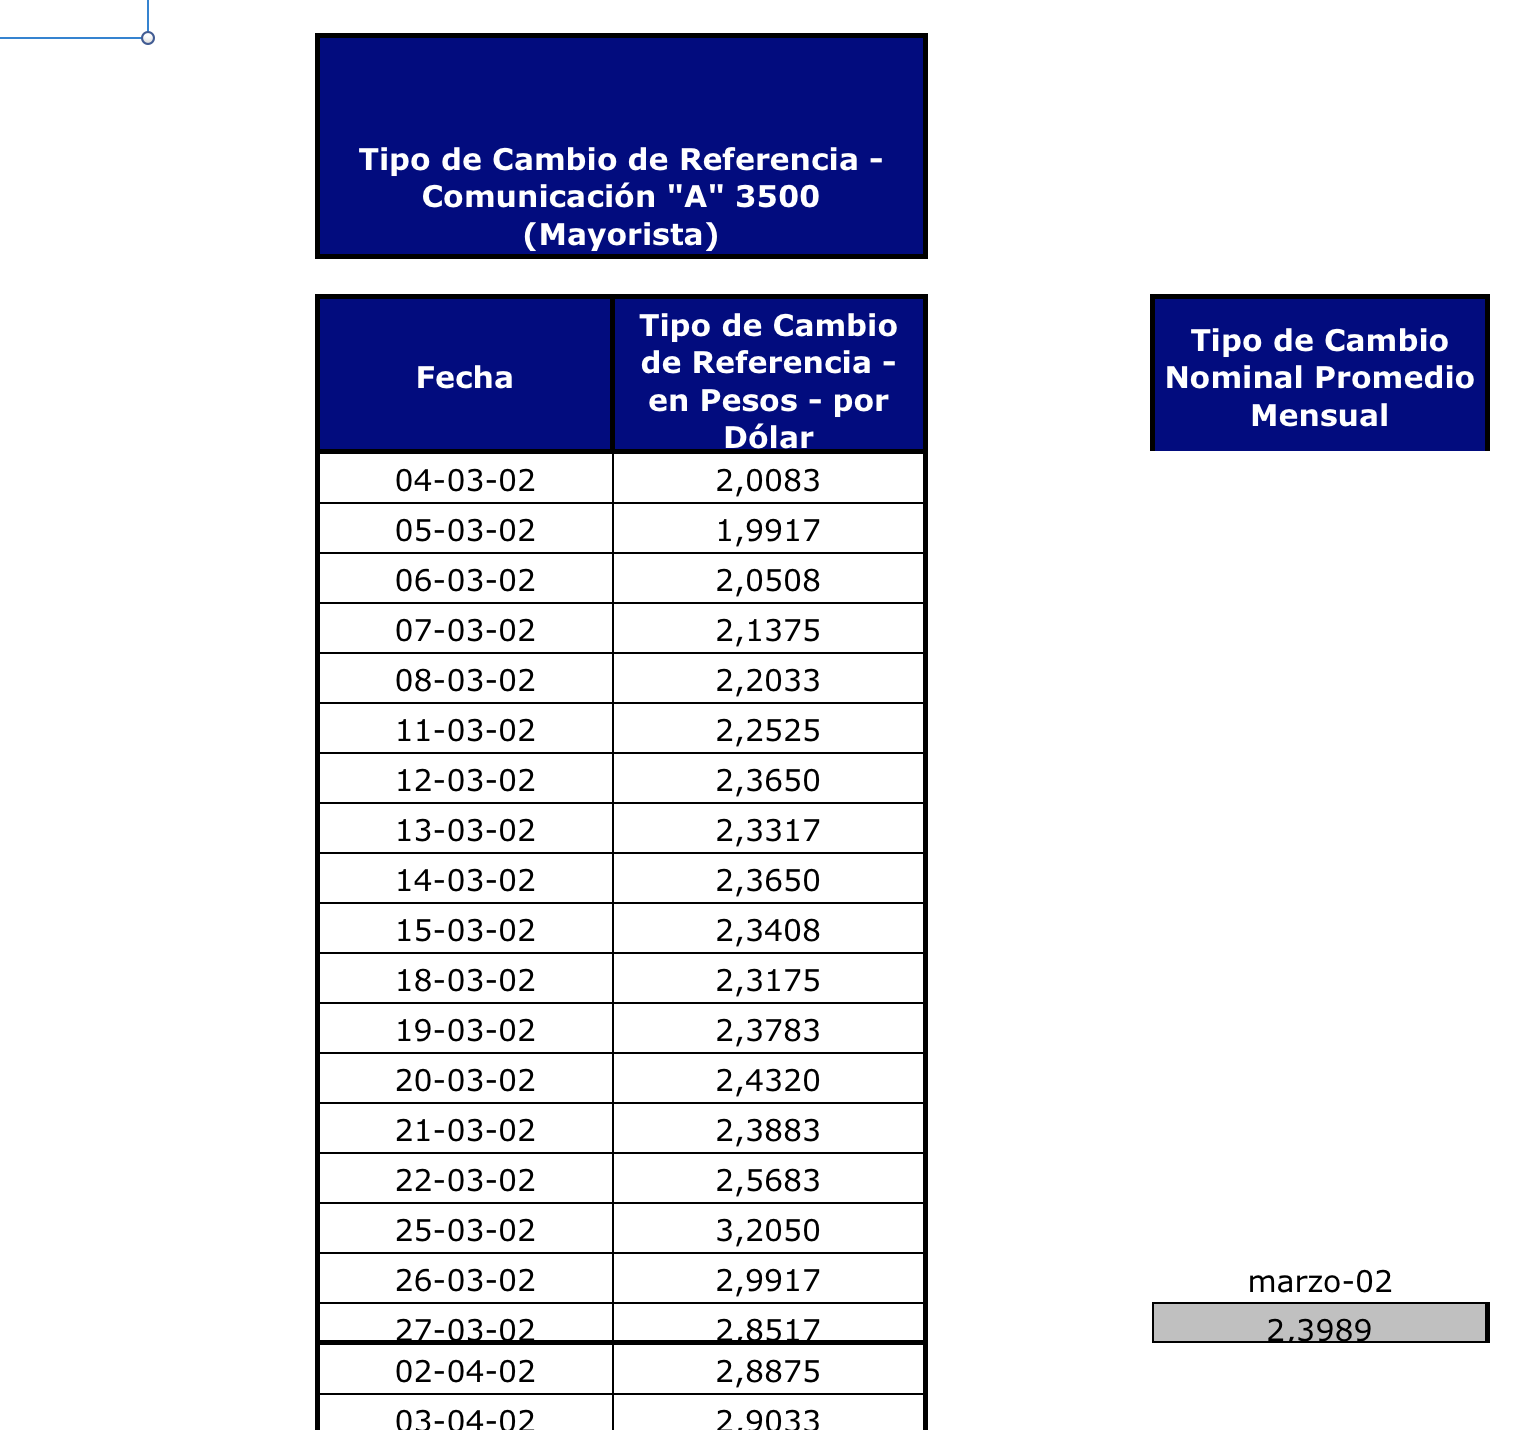
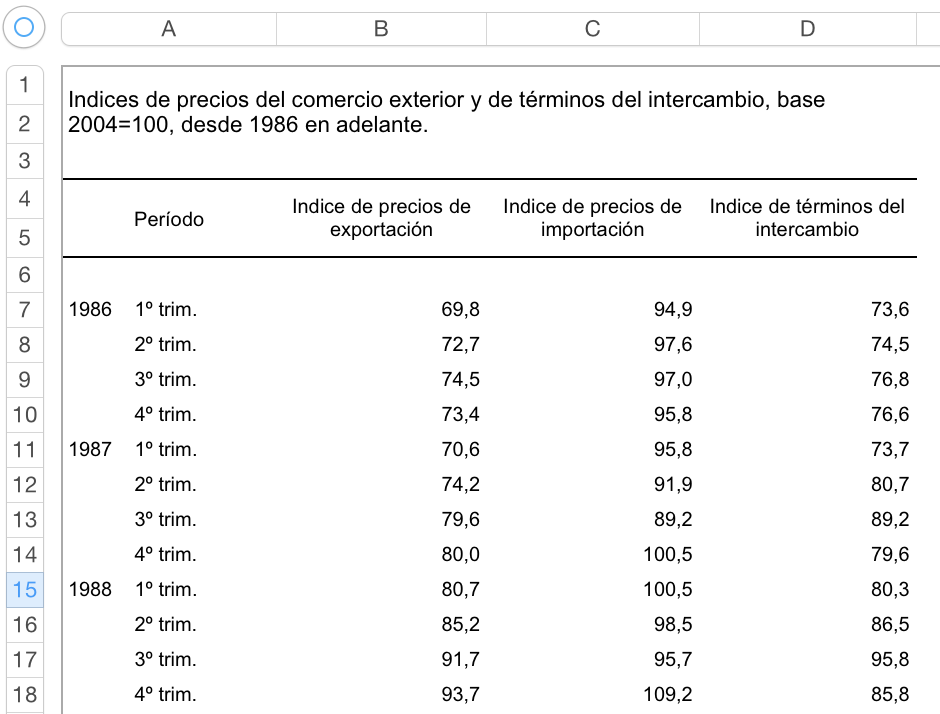
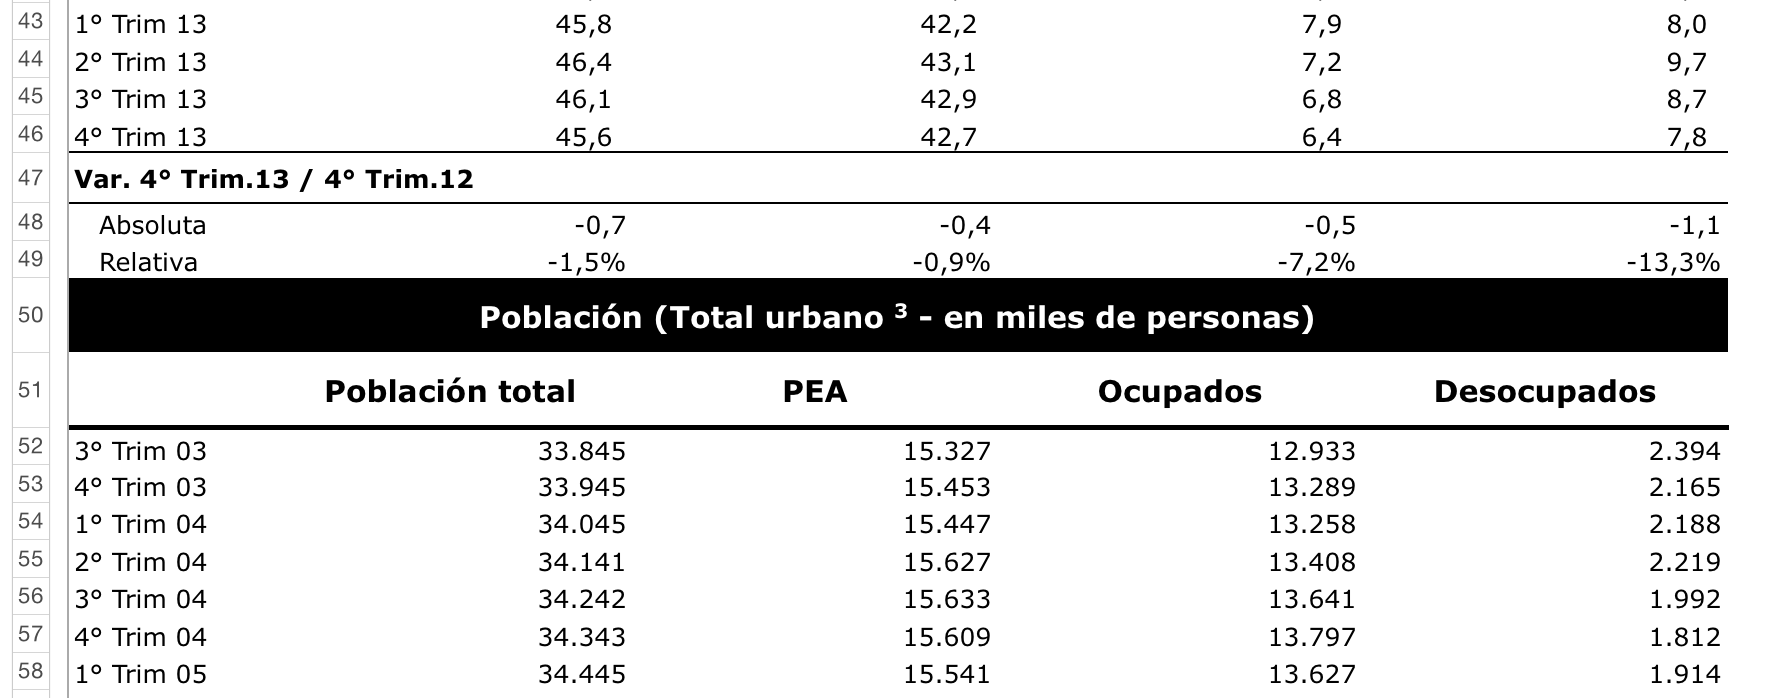
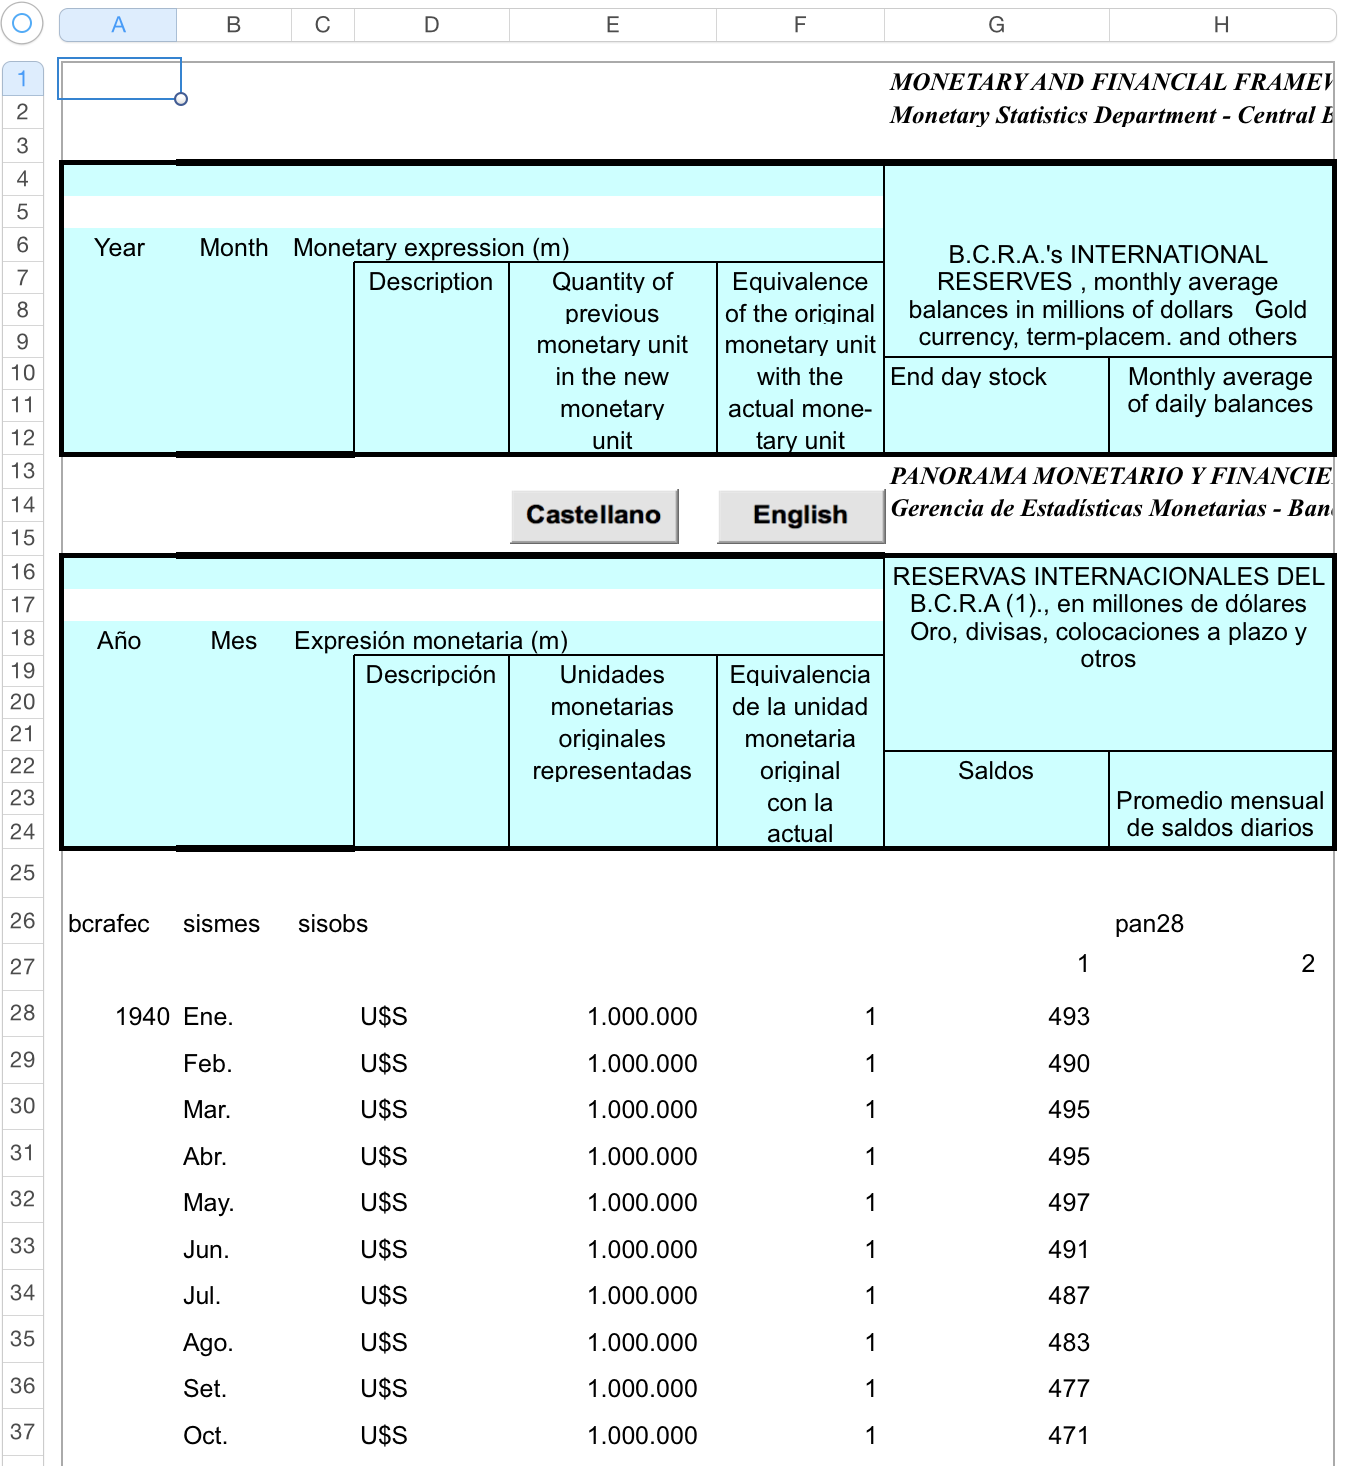
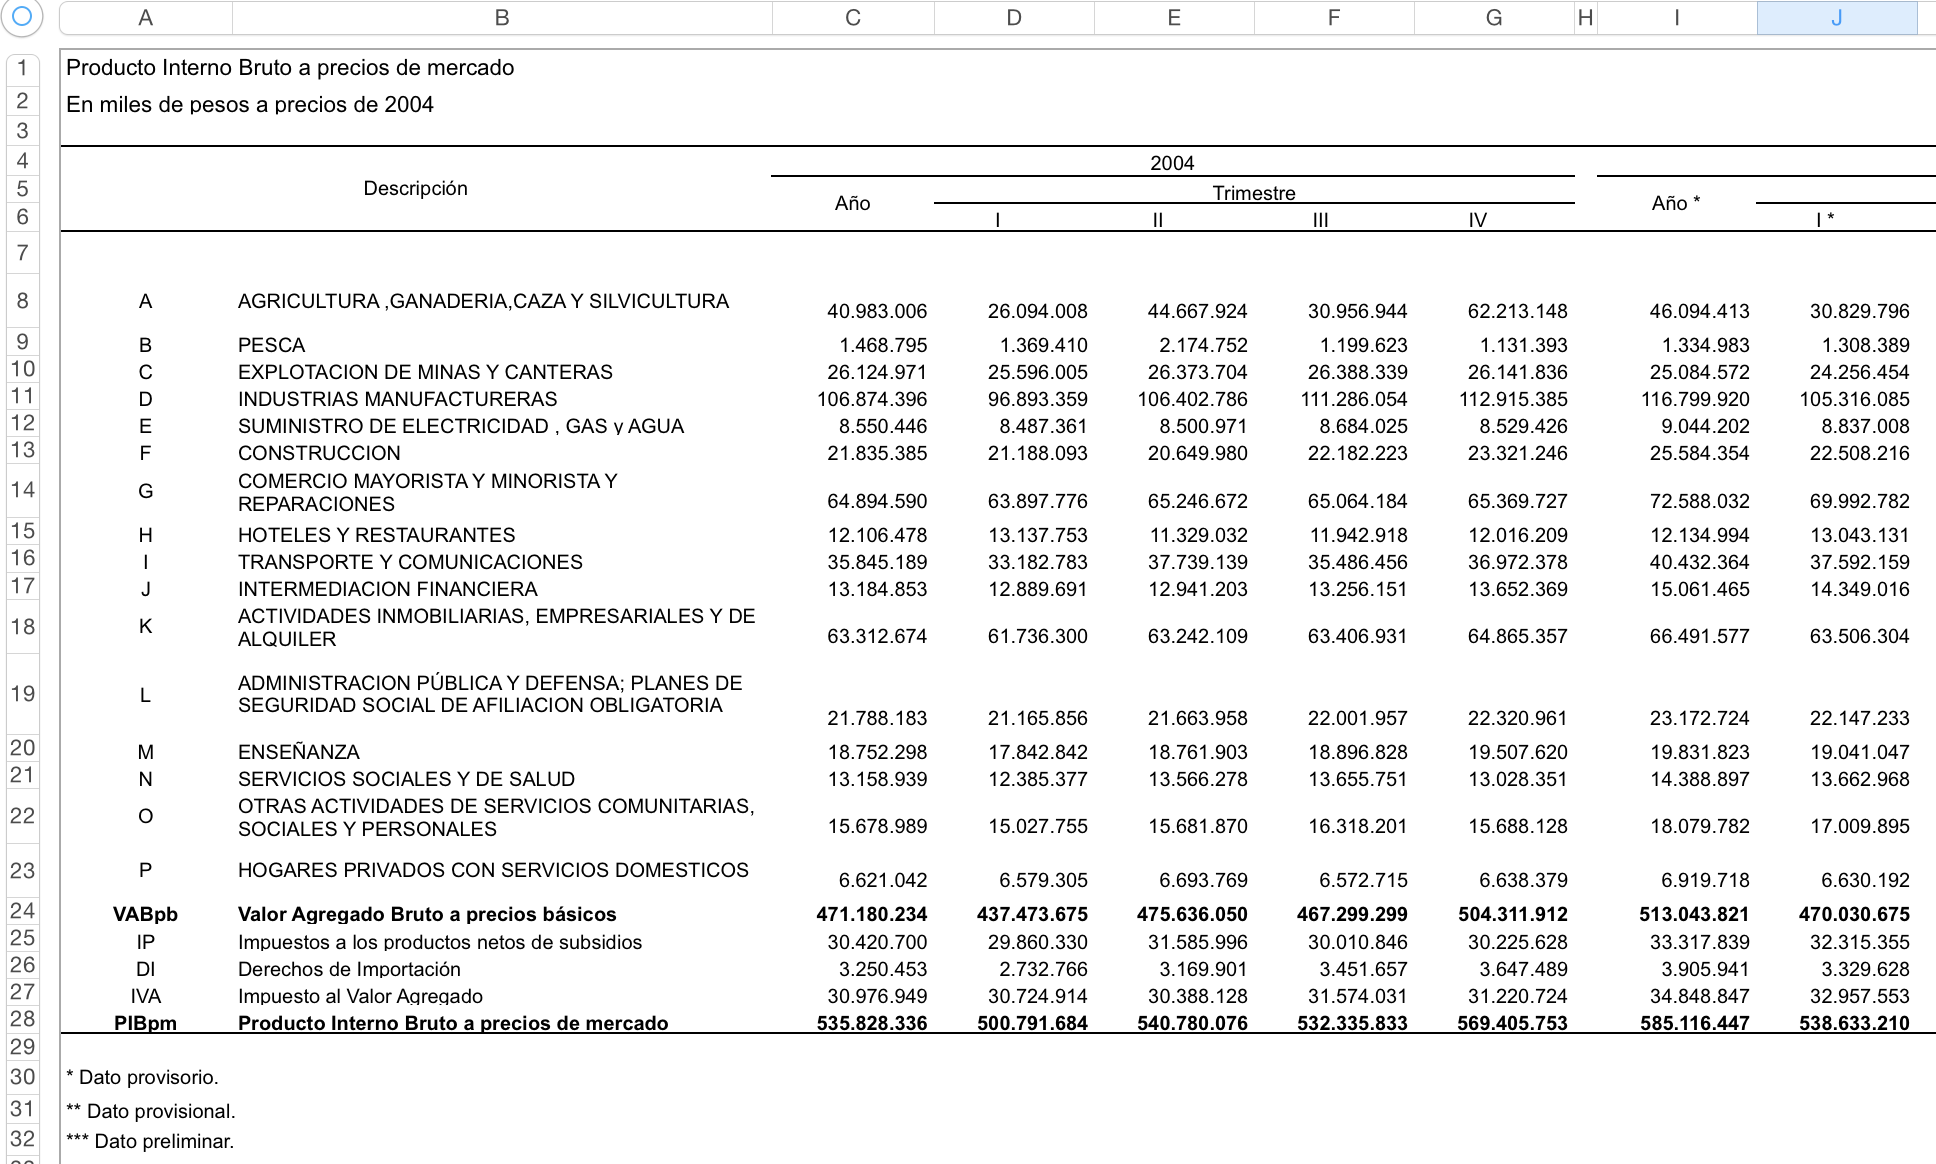
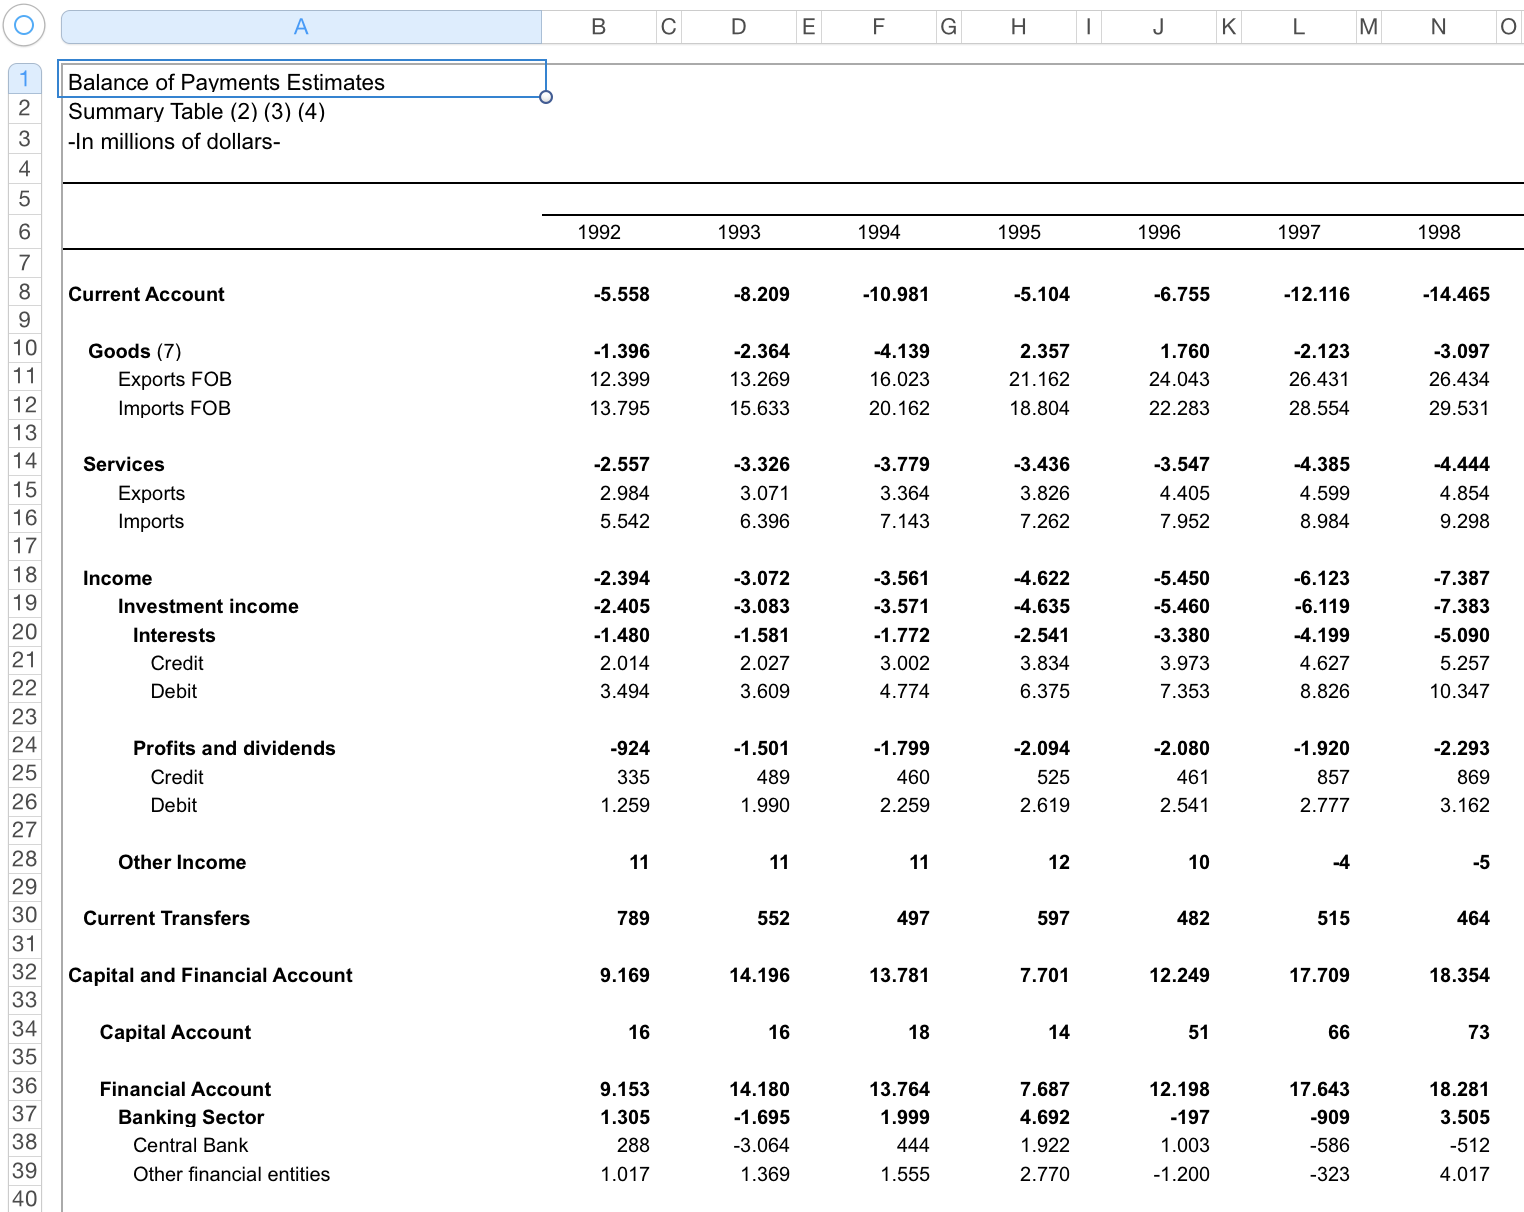
A python package to scrape time series from any excel file. Like these ones:
And return them turned into pandas data frames.
This package is still in a heavy development stage and the design may still be object of radical changes. Anyway, if you want to give it a try or contribute follow these instructions to install it on your machine.
If you want to install it in developer mode, clone the repository and:
If you are using Anaconda as your python distribution
conda create -n xlseries python=2Create new environmentcd project_directorysource activate xlseries(on Mac) oractivate xlseries(on Windows) Activate the environmentpip install -e .Install the package in developer modepip install -r requirements.txtInstall dependenciesdeactivateDeactivate when you are done
If you are using a standard python installation
cd project_directoryvirtualenv venvCreate new environmentsource venv/bin/activateActivate the environmentpip install -r requirements.txtInstall dependenciesdeactivateDeactivate when you are done
If you just want to use it without hacking on it:
Avoid cloning the repository and pip install xlseries in your virtual environment, instead of pip install -e . and pip install -r requirements.txt.
If you want to check the installation was successful and everything is working ok:
from xlseries import run_all_tests
run_all_tests.main()from xlseries import XlSeries
xl = XlSeries("path_to_excel_file" or openpyxl.Workbook instance)
dfs = xl.get_data_frames("path_to_json_parameters" or parameters_dictionary)With the test case number 1:
from xlseries import XlSeries
from xlseries.utils.path_finders import get_orig_cases_path, get_param_cases_path

# this will only work if you clone the repo with all the test files
path_to_excel_file = get_orig_cases_path(1)
path_to_json_parameters = get_param_cases_path(1)

xl = XlSeries(path_to_excel_file)
dfs = xl.get_data_frames(path_to_json_parameters)
or passing only the critical parameters as a dictionary:
parameters_dictionary = {
    "headers_coord": ["B1","C1"],
    "data_starts": 2,
    "frequency": "M",
    "time_header_coord": "A1"
}
dfs = xl.get_data_frames(parameters_dictionary)
you can specify what worksheet you want to scrape (otherwise the first one will be used):
dfs = xl.get_data_frames(parameters_dictionary, ws_name="my_worksheet")you can ask an XlSeries object for a template dictionary of the critical parameters you need to fill:
>>> params = xl.critical_params_template()
>>> params
{'data_starts': 2,
 'frequency': 'M',
 'headers_coord': ['B1', 'C1', 'E1-G1'],
 'time_header_coord': 'A1'}
>>> params["headers_coord"] = ["B1","C1"]
>>> dfs = xl.get_data_frames(params, ws_name="my_worksheet")
if this doesn't work and you want to see exactly where the scraping is failing, you may want to fill out all the parameters and try again to see where the exception is raised:
>>> params = xl.complete_params_template()
>>> params
{'alignment': u'vertical',
 'blank_rows': False,
 'continuity': True,
 'data_ends': None,
 'data_starts': 2,
 'frequency': 'M',
 'headers_coord': ['B1', 'C1', 'E1-G1'],
 'missing_value': [None, '-', '...', '.', ''],
 'missings': False,
 'series_names': None,
 'time_alignment': 0,
 'time_composed': False,
 'time_header_coord': 'A1',
 'time_multicolumn': False}
>>> params["headers_coord"] = ["B1","C1"]
>>> params["data_ends"] = 256
>>> params["missings"] = True
>>> dfs = xl.get_data_frames(params, ws_name="my_worksheet")- Excel file: Up to this development point the excel file should not be more complicated than the 7 test cases:
- Parameters: Together with the excel file, some parameters about the series must be provided. These could be passed to get_data_frames() as a path to a JSON file or as a python dictionary.
xlseriesuse about 14 parameters to characterize the time series of a spreadsheet, but only 4 of them are critical most of the time: the rest can be guessed by the package. The only difference between specifying more or less parameters than the 4 critical is the total time thatxlserieswill need to complete the task (more parameters, less time).- Go to the parameters section for a more detailed explanation about how to use them, and when you need to specify more than the basic 4 (
headers_coord,data_starts,frequencyandtime_header_coord).
- Go to the parameters section for a more detailed explanation about how to use them, and when you need to specify more than the basic 4 (
Take a look to this [ipython notebook template](docs/notebooks/Example use case.ipynb) to get started!.
If you want to dig inside the test cases and get an idea of how far is going xlseries at the moment, check out this [ipython notebook with the 7 test cases](docs/notebooks/Test cases.ipynb).
Table of Contents generated with DocToc
- Problem context (or why this package is a good idea)
- Parameters
- Development status
- Contributions
- Brainstorming and design thoughts about the package
- License
Researchers, students, consultants and civil activists that use public data waste a lot of time finding, downloading, understanding, parsing, transforming, comparing, structuring and ultimately updating the data they need to use in their analysis. The process is so time/effort consuming sometimes that can diminish notoriously the capacity of a team or an individual of doing the actual job with the data. Valuable data is not used, avoidable errors are made, duplicity of work is done everywhere, history of data is very often lost, similar data is not compared and ultimate analysis is done with less time, patience and resources than could and should be done.
A package like this one, would be an invaluable tool for automating the process of using data published only in human-readable excel layouts.
There are many public organisms (generally, international organisms) that do a huge work in this field gathering and centralizing time series from many countries, but very often this sources are not good enough for researchers working in developing countries problematics due to a number of problems:
- Developing countries data is frequently scarce, incomplete or doubtful in those big data collector organisms. These are better sources for developed countries data.
- International organisms do not use lots of valuable data coming from non official sources that are key to researchers.
- International organisms make decisions about the data to present a final time-series piece, but lots of comparisons, analysis and research-specific considerations can not be made if only one version of a data series is provided.
- International organisms have a specific target or framework for its data collection activity that sometimes aims to force cross country comparability or targets certain kinds of data.
Some of the best institutions that collect and organize data are:
- FRED (Federal Reserve Economic Data): Excel Add-In, website search, entire database downloadable.
- World Bank: API, python library, stata library, website search, entire database downloadable.
- OECD: API, webiste search.
- Normally, data is available in excel format. There is no structured APIs to access data programatically.
- Excel layouts can be very different, even within a single source, and frequently complicated to parse.
- Similar time series across different public offices show different numbers.
- Data is shown in one or more fixed transformations, there is no tool to acquire data with a chosen transformation.
- Data change significantly over time due to re-estimations, there is no track of these changes. Once they are done, original data is lost or complicated to recover and use.
- Updating previously used data with new values requires download and process data again almost duplicating previous work.
- Data series may have several mistakes sometimes. Methodological notes are not always very clarifying and there is no interactive way to share concerns about data with the community that uses it.
- Data is sometimes really hidden. There is no easy or centralized way of searching quickly through the entire corpus of existent public data.
Each time series has it's own parameters. Parameters can be passed to XlSeries.get_data_frames() as a path to a json file that looks like this:
Complete parameters for test case 2 in JSON formatting
{"alignment": "vertical",
 "headers_coord": ["D4", "F4"],
 "data_starts": [5, 22],
 "data_ends": [2993, 2986],
 "frequency": ["D", "M"],
 "time_header_coord": ["C4", "F4"],
 "time_multicolumn": false,
 "time_composed": false,
 "time_alignment": [0, -1],
 "continuity": [true, false],
 "blank_rows": [false, true],
 "missings": [true, false],
 "missing_value": ["Implicit", null],
 "series_names": null}
or as a python dictionary that look like this:
{"alignment": "vertical",
 "headers_coord": ["D4", "F4"],
 "data_starts": [5, 22],
 "data_ends": [2993, 2986],
 "frequency": ["D", "M"],
 "time_header_coord": ["C4", "F4"],
 "time_multicolumn": False,
 "time_composed": False,
 "time_alignment": [0, -1],
 "continuity": [True, False],
 "blank_rows": [False, True],
 "missings": [True, False],
 "missing_value": ["Implicit", None],
 "series_names": None}
If many series are to be scraped from a single excel file, parameters for each series should be written in lists, but only if they differ between series (as you can see in the previous example). It is not necessary to write parameters that repeat themselves in all the series (like the alignment, which is usually common to all the series in the spreadsheet).
Disclaimer: The list and description of parameters can change any time, as this project is still under heavy development.
When parameters differ between series (and if they are not optional), they must be treated as critical and be provided by the user. In that sense, the critical parameters that test case 2 needs to run are:
{"headers_coord": ["D4", "F4"],
 "data_starts": [5, 22],
 "frequency": ["D", "M"],
 "time_header_coord": ["C4", "F4"],
 "time_alignment": [0, -1],
 "continuity": [True, False],
 "blank_rows": [False, True],
 "missings": [True, False],
 "missing_value": ["Implicit", None]}
In the following descriptions, parameters without quotes are non-string values in the json_way (python_way)
The user must specify at least these 4 parameters:
- headers_coord: "B4" - Excel coordinates for a series header.
- time_header_coord: "A3" - Excel coordinates for a time index header.
- data_starts: 4 - The index of row or column where data starts.
- frequency: "Y", "Q", "M", "W", "D" or "YQQQQ" and other multi-frequency patterns - Indicates the time frequency of the series. It uses pretty much the same strings as
datetime.datetimeuses with the substantial aggregation of multi-frequency patterns, when a series has values in more than one frequency at the same row (typically a secondary series is the aggregated version of the other one). "YQQQQ", for example, indicates the presence of series that shows first the annual average (or sum) and then the four quarters.
The following parameters can be guessed by the package, but only if they don't differ between series. Any parameters whose values differ between the series to be scraped (the ones specified in headers_coord) must also be specified.
- alignment: "Vertical", "Horizontal" - Alignment of the series in the spreadsheet.
- time_multicolumn: true (True), false (False) - Indicates if a data series has a time index expressed in multiple columns that must be composed.
- time_composed: true (True), false (False) - Indicates if a data series has a time index that has to be composed (not a straight forward date string) because some information about current date is taken from previous cells. Typically when year is only stated a the first quarter while the other three have only the quarter number.
- time_alignment: 0, -1, +1 - 0: Time index run parallel to data, -1: Time value is right before data value cell, +1: Time value is right after data value cell.
- continuity: true (True), false (False) - Indicates if a data series is interrupted by strings that are not data.
- blank_rows: true (True), false (False) - Indicates if a data series is interrupted by blank rows.
- missings: true (True), false (False) - Indicates the presence of missing values in data.
The parameter missing_value should be specified every time that a special kind of missing value that is not "", null (None) or "." could appear in the series and should be taken as a missing value instead of an error or the end of the series.
- missing_value: "", ".", "NA", null (None), "Implicit" or other values - State the value that should be taken as "missing". "Implicit" is a special missing value that means that there are missing values not showed in the spreadsheet (time index is not continuous, typically in day frequency when weekends are not taken into account).
- data_ends: 254 - The index of row or column where data ends. This should only be specified in one of the following situations:
- The user only wants to pull data up to a certain row or column.
- The user wants to pull data up to a point that differs to the end of the time index (the package use the end of the time index to set the end of data)
- series_names: "Real GDP" - Names of the series (this is not necessary if headers_coord is provided). This parameter is not working yet, but it will be an alternative to specify the header coordinates. This will be useful to prevent against changes in the excel layout that may displace the headers from the original coordinate. If both parameters are specified (headers_coord and series_names), the second one will act as a "validation" of the names found in the headers_coord, providing a stricter safe check. Again, this parameter is still an idea for a future version, do not attempt to use it yet.
There are 7 test cases. Each test case was chosen because it adds something new that xlseries wasn't able to deal with it before. Next, there is a list of new issues brought by each case, in addition to the previous ones.
If you find a new test case that cannot be solved by xlseries in its current development stage, I would greatly appreciate you sending it to me.
Change from date format to string format (excel types) unexpectedly (left) Human typo in the month of "06-05-11" that should be "06-07-11" (right)
* Quarterly frequency (always - not multi-frequency) * No secondary series * Time-stamp in string format. String composed in the same cell. * Footnotes with source * Composed name with hierarchy and aggregation of same hierarchy levels * Missings with strings * Aggregation data close to the series * New data series starting after previous ones * Interrupted layout of data series * Composed time-stamp using more than one cell * Time-stamp header far from data starting * Dirty cells between headers and data start * False series (meta-data for other series) * Horizontal series (always) - Position of header and footer changes! (is not only a matter of transposing the entire sheet) * Composed time-stamp plus two frequencies (aggregation in between) * Different levels of aggregation mixed * Composed series names at the same hierarchy level (column with a "Total" in the end of several partial columns) * Progressive aggregation of series identifiable with sum of results, change in capitalization and bold letters * Progressive aggregation identifiable with strings indentation * Yearly seriesUp to this moment the package can handle these 7 test cases, providing some critical parameters. New test cases that may appear (with different issues than the ones covered by these ones) should be easily supported adding some code (to deal with new ways to express time values, new time index structures, new multifrequency patterns, etc) and, eventually, a new parameter (although this should be very weird.)
The ultimate goal is that for any given excel file the user can possibly have, xlseries be able to extract all time series in the spreadsheet and return pandas data frames.
All contributions are very welcome!
I aim to keep the design of this package strongly modularized and decoupled to allow working in different parts of the problem in an isolated way with respect of other parts of the system.
A non-exhaustive list of ways that you can contribute:
-
Bring more test cases that posses parsing challenges not covered by the current test cases. You can add a test case following the example of the other test cases. These can be integration test cases (an entire excel worksheet taken from the real world) or unit test cases like a new type of time string to parse that is not covered by current time-like strings used as test cases.
-
Work in the parse_time strategies. These strategies are the most important part of how time indexes are parsed into something that has a datetime.datetime type. You can add more parsers to cover existing cases, improve the ones that already exist giving them more generality or adding new test cases to then implement the parser strategies for them.
-
Start building strategies to clean values before processing them.
-
Start building meta-heuristics to (1) evaluate and compare alternative outputs for the same spreadsheet (pandas data frames) and ranking them by quality and (2) build evaluators to determine if a pandas data frame is to be considered a well scraped time data series or not.
-
Start working in the still virgin area of discovering the parameters. The package still need a list of critical parameters to process the excel files. Many approaches will have to be researched to start building strategies for discovering the parameters of an excel file with time data series:
- Every parameter has a new module with a bunch of possible strategies to discover it.
- Machine learning that takes low level input parameters (size of sheet, types of cell values, cell values formatting, etc.) and output the discovered higher level parameter.
- Trying random parameters and examining the output of the package as a way to discover the correct parameter (this is the only approach explored up to this moment).
-
Start writing the docs.
-
Propose different high level designs / rework modules to decouple steps of the algorithms used or to modularize better parts of the system.
Code style conventions
For all contributions, we intend to follow the Google Ptyhon Style Guide
Proximately these two files will be moved to issues, to encourage the participation of other people! You can check out some design thoughts to look into some decisions that were made (and some decisions that are still being evaluated) and some brainstorming ideas about possible strategies to discover parameters and other stuff like that.
Copyright 2015 Agustin Benassi
Released under GPL3, like GNU readline.
This program is free software: you can redistribute it and/or modify it under the terms of the GNU General Public License as published by the Free Software Foundation, either version 3 of the License, or (at your option) any later version.
This program is distributed in the hope that it will be useful, but WITHOUT ANY WARRANTY; without even the implied warranty of MERCHANTABILITY or FITNESS FOR A PARTICULAR PURPOSE. See the GNU General Public License for more details.
You should have received a copy of the GNU General Public License along with this program. If not, see http://www.gnu.org/licenses/.

