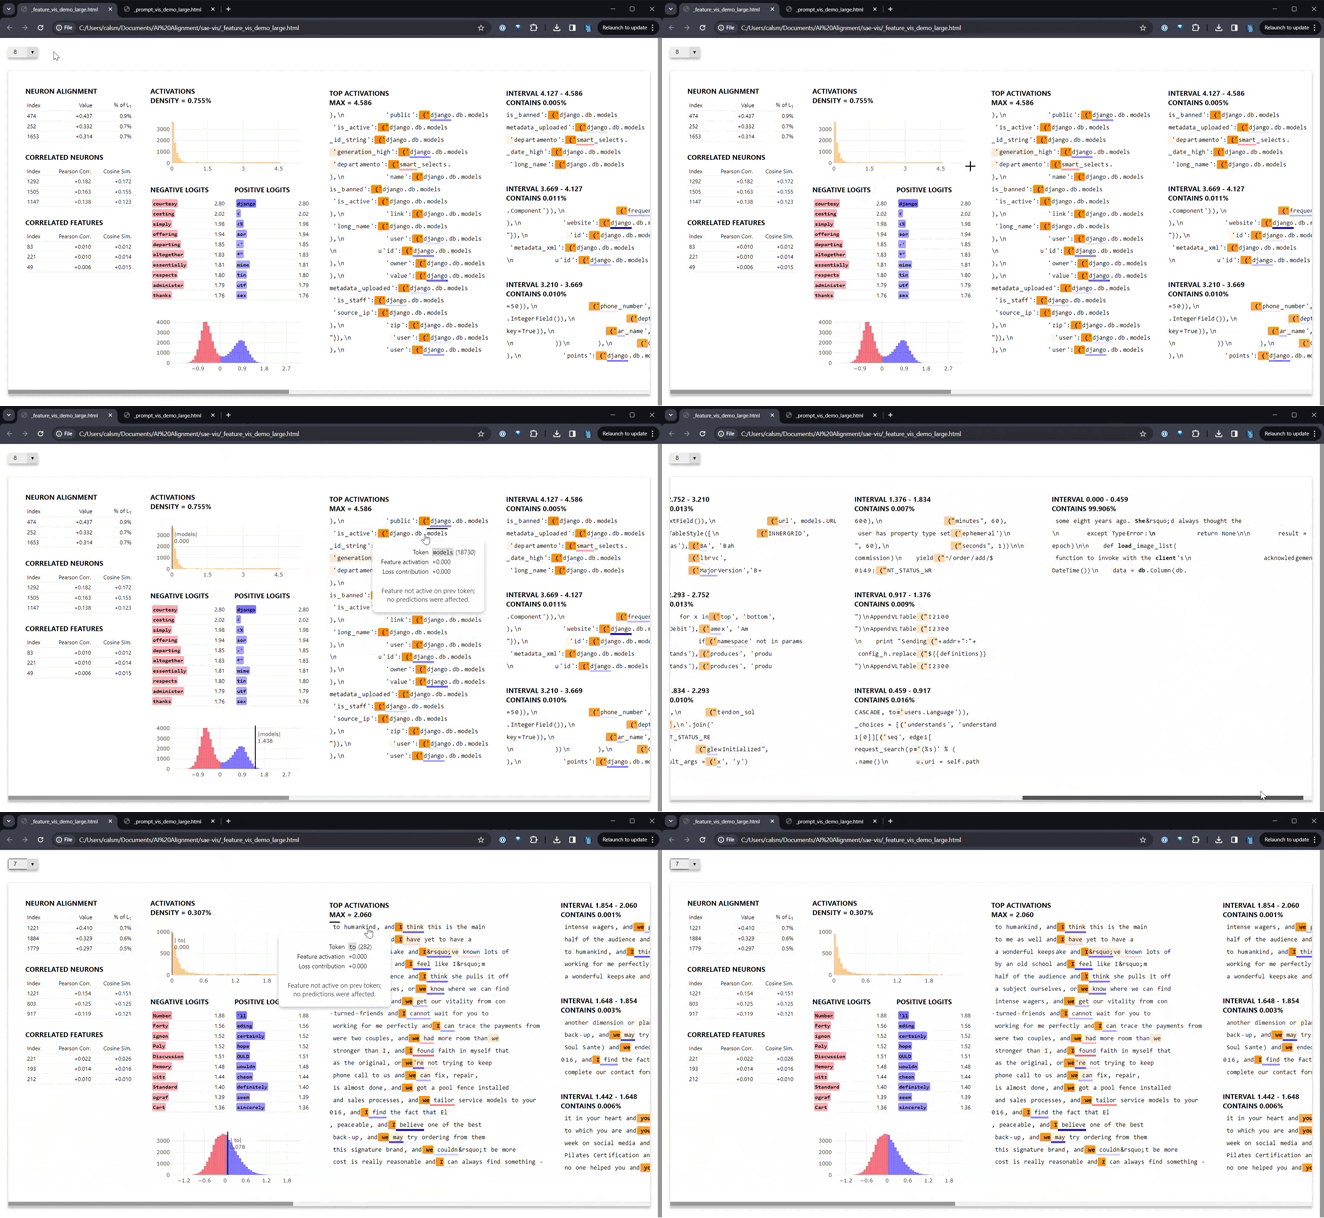
SAEDashboard is a tool for visualizing and analyzing Sparse Autoencoders (SAEs) in neural networks. This repository is an adaptation and extension of Callum McDougal's SAEVis, providing enhanced functionality for feature visualization and analysis as well as feature dashboard creation at scale.
This codebase was originally designed to replicate Anthropic's sparse autoencoder visualizations, which you can see here. SAEDashboard primarily provides visualizations of features, including their activations, logits, and correlations--similar to what is shown in the Anthropic link.
- Customizable dashboards with various plots and data representations for SAE features
- Support for any SAE in the SAELens library
- Neuronpedia integration for hosting and comprehensive neuron analysis (note: this requires a Neuronpedia account and is currently only used internally)
- Ability to handle large datasets and models efficiently
Install SAEDashboard using pip:
pip install sae-dashboardHere's a basic example of how to use SAEDashboard with SaeVisRunner:
from sae_lens import SAE
from transformer_lens import HookedTransformer
from sae_dashboard.sae_vis_data import SaeVisConfig
from sae_dashboard.sae_vis_runner import SaeVisRunner

# Load model and SAE
model = HookedTransformer.from_pretrained("gpt2-small", device="cuda", dtype="bfloat16")
sae, _, _ = SAE.from_pretrained(
    release="gpt2-small-res-jb",
    sae_id="blocks.6.hook_resid_pre",
    device="cuda"
)
sae.fold_W_dec_norm()

# Configure visualization
config = SaeVisConfig(
    hook_point=sae.cfg.hook_name,
    features=list(range(256)),
    minibatch_size_features=64,
    minibatch_size_tokens=256,
    device="cuda",
    dtype="bfloat16"
)

# Generate data
data = SaeVisRunner(config).run(encoder=sae, model=model, tokens=your_token_dataset)

# Save feature-centric visualization
from sae_dashboard.data_writing_fns import save_feature_centric_vis
save_feature_centric_vis(sae_vis_data=data, filename="feature_dashboard.html")
For a more detailed tutorial, check out our demo notebook.
For internal use or advanced analysis, SAEDashboard provides a Neuronpedia runner that generates data compatible with Neuronpedia. Here's a basic example:
from sae_dashboard.neuronpedia.neuronpedia_runner_config import NeuronpediaRunnerConfig
from sae_dashboard.neuronpedia.neuronpedia_runner import NeuronpediaRunner

config = NeuronpediaRunnerConfig(
    sae_set="your_sae_set",
    sae_path="path/to/sae",
    np_set_name="your_neuronpedia_set_name",
    huggingface_dataset_path="dataset/path",
    n_prompts_total=1000,
    n_features_at_a_time=64
)

runner = NeuronpediaRunner(config)
runner.run()
For more options and detailed configuration, refer to the NeuronpediaRunnerConfig class in the code.
SAEDashboard offers a wide range of configuration options for both SaeVisRunner and NeuronpediaRunner. Key options include:
hook_point: The layer to analyze in the modelfeatures: List of feature indices to visualizeminibatch_size_features: Number of features to process in each batchminibatch_size_tokens: Number of tokens to process in each forward passdevice: Computation device (e.g., "cuda", "cpu")dtype: Data type for computationssparsity_threshold: Threshold for feature sparsity (Neuronpedia runner)n_prompts_total: Total number of prompts to analyzeuse_wandb: Enable logging with Weights & Biases
Refer to SaeVisConfig and NeuronpediaRunnerConfig for full lists of options.
This project uses Poetry for dependency management. After cloning the repo, install dependencies with poetry lock && poetry install.
We welcome contributions to SAEDashboard! Please follow these steps:
- Fork the repository
- Create a new branch for your feature
- Implement your changes
- Run tests and checks:
- Use
make formatto format your code - Use
make check-cito run all checks and tests
- Use
- Submit a pull request
Ensure your code passes all checks, including:
- Black and Flake8 for formatting and linting
- Pyright for type-checking
- Pytest for tests
To cite SAEDashboard in your research, please use the following BibTeX entry:
@misc{sae_dashboard,
    title  = {{SAE Dashboard}},
    author = {Decode Research},
    howpublished = {\url{https://github.com/jbloomAus/sae-dashboard}},
    year   = {2024}
}SAE Dashboard is licensed under the MIT License. See the LICENSE file for details.
This project is based on the work by Callum McDougall. If you use SAEDashboard in your research, please cite the original SAEVis project as well:
@misc{sae_vis,
  title = {{SAE Visualizer}},
  author = {Callum McDougall},
  howpublished = {\url{https://github.com/callummcdougall/sae_vis}},
  year = {2024}
}For questions or support, please open an issue on our GitHub repository.
